Research Article - (2023) Volume 13, Issue 1
INFLIBNET and its use among Faculty Members and Research Scholars: A Study of Ch. Charan Singh University, Meerut
Jamal Ahmad Siddiqui* and RubiAbstract
The present paper explains about INFLIBNET and its services also examined use of services among faculty members and research scholars in Ch. Charan Singh university, Meerut. Further, the data is collected through a questionnaire to study the information needs of the faculty members and researchers in university campus and use of UGC-Infonet Consortium, shodhganga, union database by the faculty members and research scholars in university campus. The paper revealed that UGC Infonet consortium is much helpful in fulfilling their information needs. There is need to train the faculty members and research scholars in using the INFLIBNET services. Also examines the satisfaction of users about INFLIBNET services.
Keywords
E-resources, Digital resources, University of Jammu, UGC-infonet, Consortium.
Introduction
The Information and Library Network (INFLIBNET) center is located at the Gujarat university campus, Ahmedabad. The services of the center are specifically towards modernization of academic libraries and information centers, to promote information transfer, learning and academic pursuits [1]. The center acts as a nodal agency for networking of libraries and information centers, in universities, institutions of higher learning and R and D institutions in India. The center was established in May 1996 and set out to be a major player for promoting scholarly communication among academicians and researchers across the country.
The center, on behalf of the UGC, has taken-up a number of initiatives for the benefit of the academic community. These initiatives include:
•UGC-lnfonet connectivity programmer for networking of university campuses andinternet connectivity.
•UGC-lnfonet digital library consortium.
•Shodhganga: A reservoir of Indian electronic theses and dissertations.
•Open Journals Access System (OJAS).
•Access management technologies that would facilitate users to access e-resourcesirrespective of their physical location.
About Ch. Charan Singh university libra
Ch. Charan Singh university (formerly Meerut university) library was established in 1968 to serve the academic community of the university in particular and this region of the state in general. The designing of the library building was planned in consultation with the renowned architect and library experts. Construction of the library was started in 1970 and it was formally declared open 11th January 1972. The shoebox type library building is designed on modularpattern. Its countless louvers, gentle ramps and full length glass panels on all sides add to its beauty [2]. It provides 2655.38 sq. meters of floor area spread over four floors. The library is now known as Raja Mahendra Pratap library. The library has a collection of around 150,000 books on its shelves, 30000 bound volumes of journals, 13000 theses, 2884 electronic theses. Library is subscribing to more than 300 print journals and more than 100 e-journals. It remains open from 8.00 AM to 12.00 PM [3].
The project of computerization of central library has been taken as the priority of the library. SOUL 2.0 Library software developed by UGC INFLIBNET has been installed for the automation of the library. 20 computers have been installed in the various sections of the library on LAN [4]. The data entry of the holdings of the library is in process. Entire collection of library is entered in software and bar code is provided to each document for circulation purpose. The library is now totally automated using bar code technology in its lending operations. An OPAC (On line public access catalogue) is provided for students queries. Master cards to the members of the library are issued. The online catalogue of the library is available on web (Figure 1)[5].
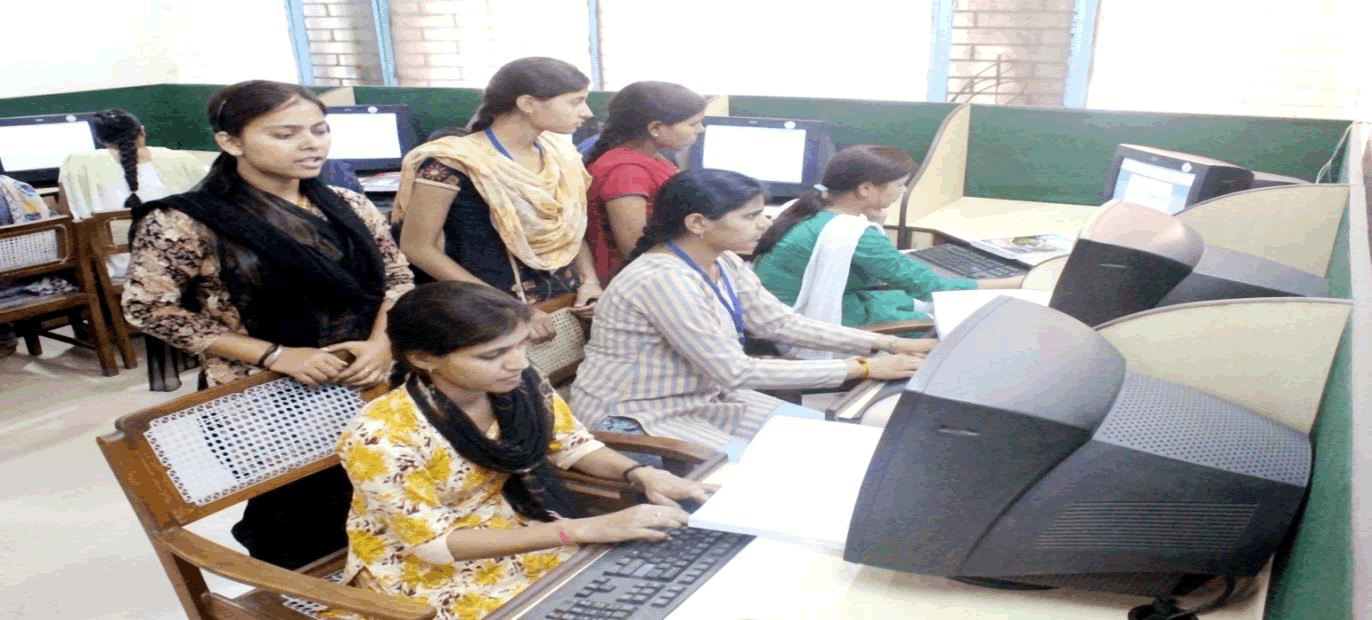
Figure 1: The online catalogue of the library
•Library is the member of UGC INFLIBNET e-journal consortia programmer and isproviding more than 8000 full text e-journals.
•Library has also created a digital database of Ph.D. Theses submitted to this university.
•Library is subscribing back volumes of e-journals in the field of social sciences,besides more than 100 e-journals [6].
•Shodhganga provides digital theses of different university libraries, enabling the usersto read full text theses submitted in different university libraries.
Objectives of the study
•To identify the information needs of the research scholars, faculty members and otherusers in Ch. Charan Singh university library.
•To know the knowledge about INFLIBNET and its services among the faculty members, research scholars and other users.
•To know the knowledge about e-resources.
•To know the extent of the use of e-resources.
•To know about satisfaction of the information needs of the research scholars andFaculty members by e-resources under UGC-INFLIBNET programmer.
•To find out the problems in respect of UGC-Infonet consortium.
•To suggest the valuable suggestion to improvement of the library [7].
Materials and Methods
Questionnaire survey is the most popular method of collecting data today. The present survey is conducted through a questionnaire method and questionnaires were circulated among the faculty members and research scholars in different departments of Ch. Charan Singh university, Meerut. In addition, the information is collected through personal interaction with the faculty members and researchers. Of the total 100 questionnaires distributed among faculty, research scholars and other users [8]. 20 faculty members, 30 research scholars and 50 other users have provided their consent in the questionnaire. The collected data is analyzed, tabulated, interpreted and presented in form of report.
Data analysis and interpretation
INFLIBNET has its value, which no one can deny. INFLIBNET is essential for survival, progress and it is a basic need of life. User is the supreme in any information system. The benefits of information revolution are centered on the user and his convenience. The scholar has studied the information needs and use patterns of faculty members and research scholars of Chaudhary Chaaran Singh university, faculty members and research scholars perform one basic function teaching and they are expected to do research and publish results of research from time to time throughout their careers. We have used the questionnaire method to collect data and applied statistical application to test the hypothesis. The findings of the study are given in different tables and reports [9]. It was revealed that the users face difficulty in searching information through electronic sources. They need skills to use the available sources in the library.
Table 1 shows that 20% faculty members 30% research scholars 50% other users responded the 100 distributed questionnaires. Maximum response 50% received from other users and minimum response 20% from faculty members (Figure 2).
| S.No. | Category | Response | Percentage |
|---|---|---|---|
| 1 | Faculty member | 20 | 20% |
| 2 | Research scholars | 30 | 30% |
| 3 | Others | 50 | 50% |
| Total | 100 | 100% | |
Table 1: Academic status
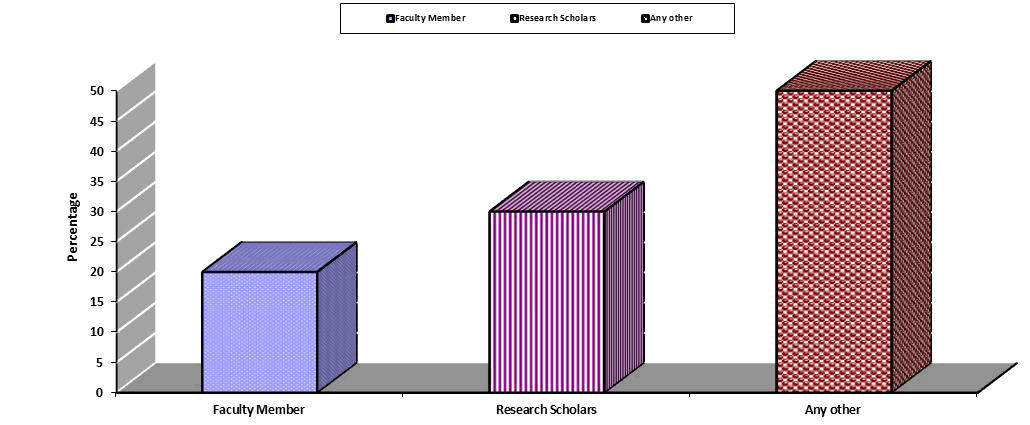
Figure 2: It shows that 20% faculty members 30% research scholars 50% other users responded the 100 distributed questionnaires
Table 2 shows the sex ratio 65% respondent belongs to male category whereas 35% belongs to female category (Figure 3).
| S.No. | Category | Response | Percentage |
|---|---|---|---|
| 1 | Male | 65 | 65% |
| 2 | Female | 35 | 35% |
| Total | 100 | 100% | |
Table 2: Sex ratio
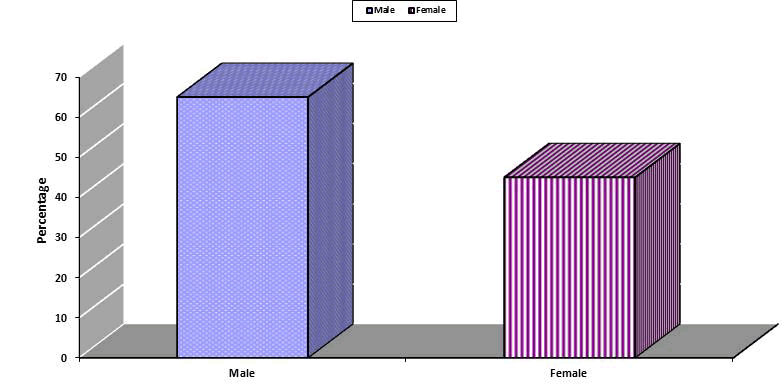
Figure 3: Sex ratio
Table 3 shows that out of 20 faculty members 5 (25%) use e-mail, 4 (20%) use academic websites, 5 (25%) use e-resources and 6 (30%) use online databases (Figure 3). Among research scholars maximum 30% prefer online databases and only 16% use academic websites. In the category of other users maximum 42% use e-mail service and only 14% access academic websites (Figure 4).
| Purpose | Faculty member | %age | Research scholar | Percentage | Any other | Percentage |
|---|---|---|---|---|---|---|
| 5 | 25 | 8 | 27 | 21 | 42 | |
| Academic website | 4 | 20 | 5 | 16 | 7 | 14 |
| E-Resources | 5 | 25 | 9 | 30 | 14 | 28 |
| Online data base | 6 | 30 | 8 | 27 | 8 | 16 |
| Total | 20 | 100 | 30 | 100 | 50 | 100 |
Table 3: Purpose of using internet in the library
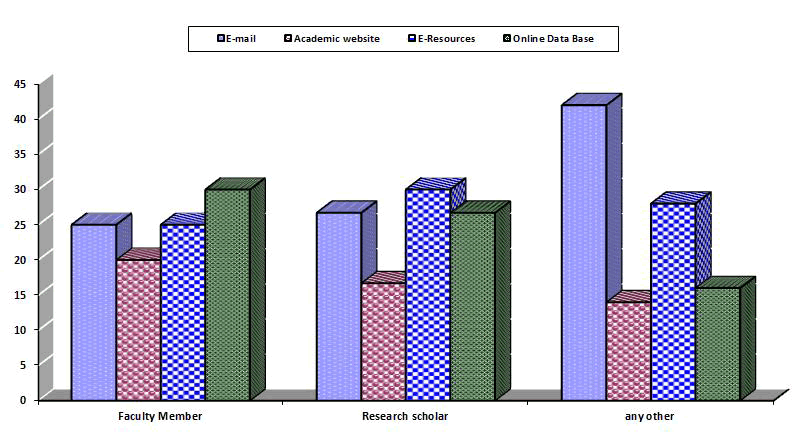
Figure 4: Shows that out of 20 faculty members 5 (25%) use e-mail, 4 (20%) use academic websites, 5 (25%) use e-resources and 6 (30%) use online databases
Table 4 shows that 13 (65%) faculty members are satisfied with the internet speed and none of the faculty member said, that the speed is very poor. Similarly 57% research scholars and 68% other users feel that the internet speed is sufficient for downloading the e-resources. 30% faculty members 37% research scholars and 20% other user’s feel that the present speed is insufficient to meet out the actual requirement of speed and therefore, it needs to be improved (Figure 5).
| Present | Faculty member | %age | Research scholar | Percentage | Any other | Percentage |
|---|---|---|---|---|---|---|
| Sufficient | 13 | 65 | 17 | 57 | 34 | 68 |
| Insufficient | 6 | 30 | 11 | 37 | 10 | 20 |
| Poor | 1 | 5 | 2 | 6 | 4 | 8 |
| Very poor | 0 | 0 | 0 | 0 | 2 | 4 |
| Total | 20 | 100 | 30 | 100 | 50 | 100 |
Table 4: Speed of internet for downloading
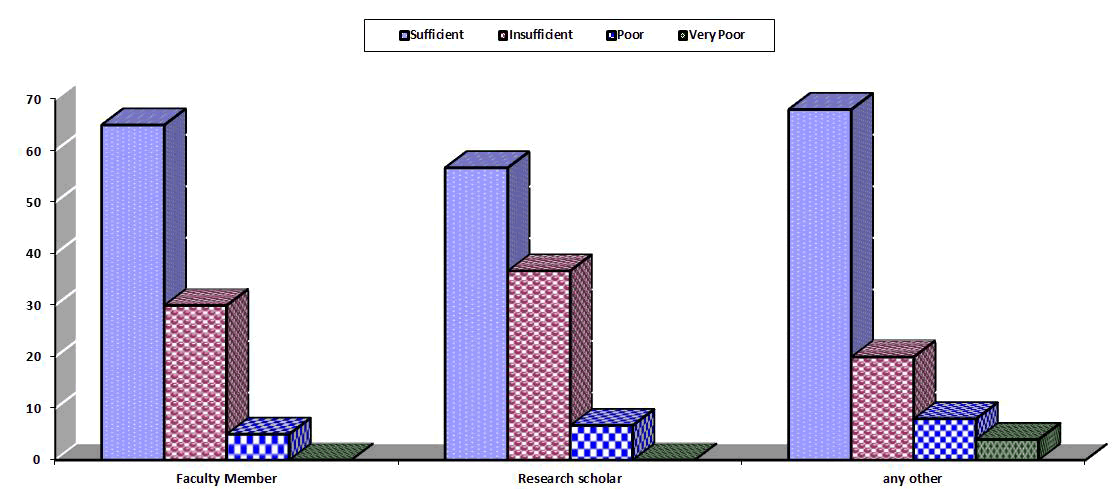
Figure 5: It shows that 13 (65%) faculty members are satisfied with the internet speed and none of the faculty member said, that the speed is very poor
Table 5 shows that maximum 35% faculty members are using e-resources since last one year, 30% are using for last two years and 10% faculty members are aware about e-resources and using them since last three or more years. Among research scholars maximum 36% have just started using e-resources and 27% equally using for last two and three years. Other users are not much aware about e-resources and they have just started using e-resources only a month back. However 12% other users are using for more than three years (Figure 6).
| Using the E-resources | Faculty member | %age | Research scholar | Percentage | Any other | Percentage |
|---|---|---|---|---|---|---|
| Since last months | 5 | 25 | 11 | 36 | 22 | 44 |
| Since last 1 year | 7 | 35 | 8 | 27 | 14 | 28 |
| Since last 2 years | 6 | 30 | 8 | 27 | 8 | 16 |
| More than 3 years | 2 | 10 | 3 | 10 | 6 | 12 |
| Total | 20 | 100 | 30 | 100 | 50 | 100 |
Table 5: Time of using the E-resources
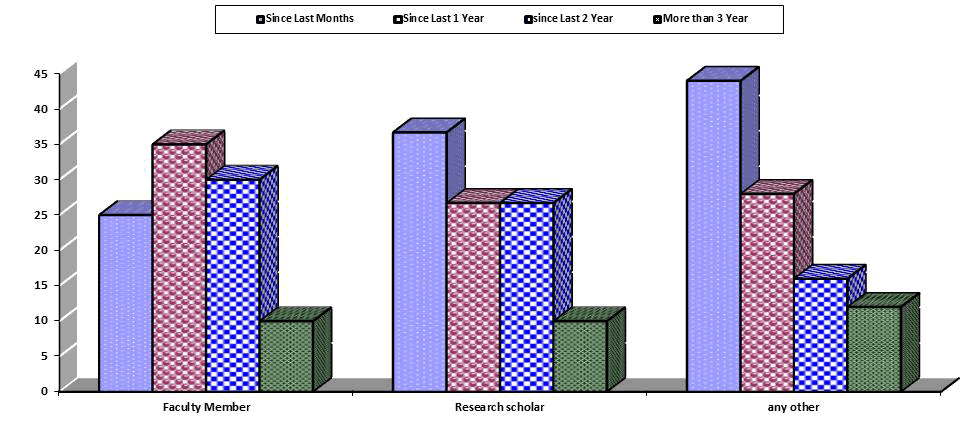
Figure 6: Shows that maximum 35% faculty members are using e-resources since last one year, 30% are using for last two years and 10% faculty members are aware about e-resources and using them since last three or more years
Table 6 shows that 10 (50%) faculty members use e-resources for less than 2 hours in a day 40% avail this facility for 2 to 3 hours a day and only 10% use e-resources as and when required. 50% research scholars use for less than 2 hours per day and 27% for 2 to 3 hours per day and only 10% consult as and when required. Other users are also using e-resources 42% for less than 2 hours, 30% for 2 to 3 hours and 22% use whenever they require (Figure 7).
| Week to use E-resources | Faculty member | Percentage | Research scholar | %age | Any other | Percentage |
|---|---|---|---|---|---|---|
| Less than 2 hours in a day | 10 | 50 | 15 | 50 | 21 | 42 |
| 2-3 hours in a day | 8 | 40 | 8 | 27 | 15 | 30 |
| More than 3 hours in a day | 0 | 0 | 4 | 13 | 3 | 6 |
| As per requirement | 2 | 10 | 3 | 10 | 11 | 22 |
| Total | 20 | 100 | 30 | 100 | 50 | 100 |
Table 6: Time spend in a day to use E-resources
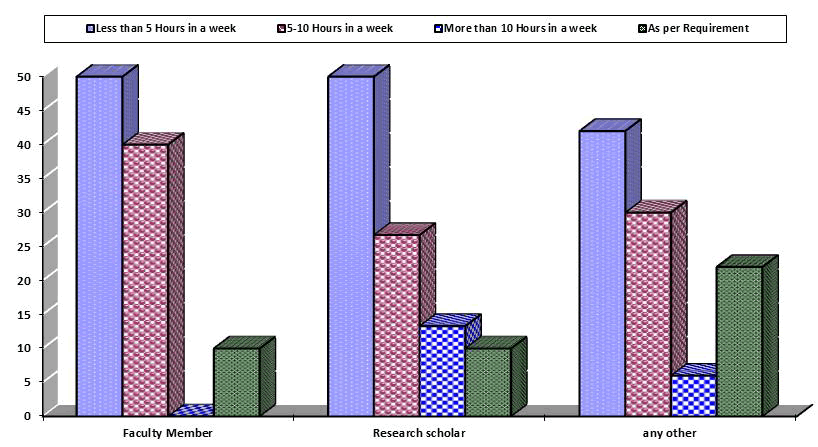
Figure 7: Shows that 10 (50%) faculty members use e-resources for less than 2 hours in a day 40% avail this facility for 2 to 3 hours a day and only 10% use e-resources as and when required
Table 7 shows that 35% faculty members, 33% research scholars and 40% other users took the training from library staff to use e-resources. 45% faculty members, 45% research scholars and 30% other users using e-resources by self-instruction. 15% faculty members 6% research scholars and 18% other users are using e-resources with the help provided by seniors. Least number of users in all categories is taking help from external sources to use e-resources (Figure 8).
| Learn to handle the E-resources | Faculty member | %age | Research scholar | Percentage | Any other | Percentage |
|---|---|---|---|---|---|---|
| Training from library staff | 7 | 35 | 10 | 33 | 20 | 40 |
| Self-instruction | 9 | 45 | 14 | 45 | 15 | 30 |
| External sources | 1 | 5 | 5 | 16 | 6 | 12 |
| From seniors | 3 | 15 | 2 | 6 | 9 | 18 |
| Total | 20 | 100 | 30 | 100 | 50 | 100 |
Table 7: How did you learn to access the E-resources
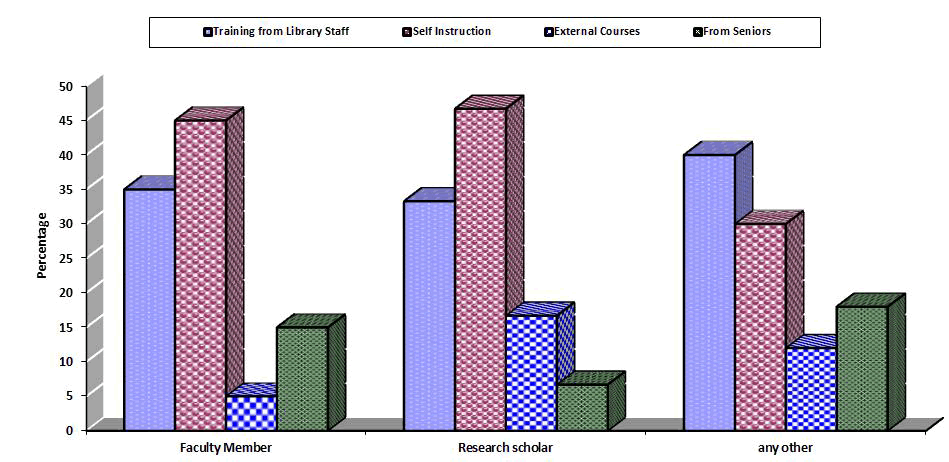
Figure 8: Shows that 35% faculty members, 33% research scholars and 40% other users took the training from library staff to use e-resources. 45% faculty members, 45% research scholars and 30% other users using E-resources by self-instruction
Results and Discussion
Table 8 shows that maximum user in all categories knew about INFLIBNET during their PG course. 13 (65%) faculty members, 18 (60%) research scholars and 37 (74%) other users are aware about INFLIBNET and its services when they were in PG course. 4 (20%) faculty members, 6 (20%) research scholars and 8 (16%) other users knew this service during their M.Phil course. Only few users in all categories either knew during Ph.D but there are few users10% faculty members, 6.7% research scholars and 10% other users are still not aware aboutINFLIBNET and its services (Figure 9).
| Know INFLIBNET | Faculty member | Percentage | Research scholar | Percentage | Any other | Percentage |
|---|---|---|---|---|---|---|
| During PG | 13 | 65 | 18 | 60 | 37 | 74 |
| During M.Phil | 4 | 20 | 6 | 20 | 8 | 16 |
| During Ph.D | 1 | 5 | 4 | 13.3 | 0 | 0 |
| Not yet | 2 | 10 | 2 | 6.7 | 5 | 10 |
| Total | 20 | 100 | 30 | 100 | 50 | 100 |
Table 8: When you know about INFLIBNET
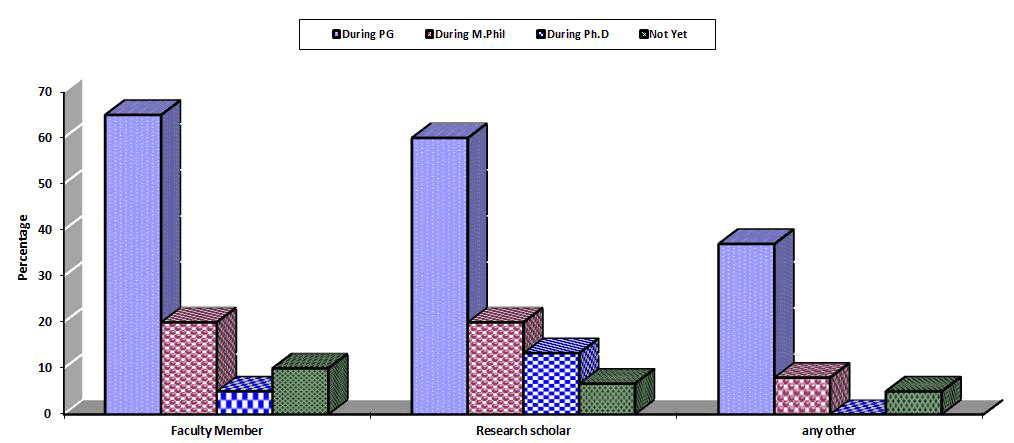
Figure 9: It shows that maximum user in all categories knew about INFLIBNET during their PG course. 13 (65%) faculty members, 18 (60%) research scholars and 37 (74%) other users are aware about INFLIBNET and its services when they were in PG course
Table 9 shows that 10 (50%) faculty members, 15 (50%) research scholars and 18 (36%) other users are using union database (OPAC) to search books. 4 (20%) faculty members, 6 (20%) research scholars and 12 (24%) other users are availing the facility of shodhganga to pursue their research work. 4 (20%) faculty members, 5 (16.7%) research scholars, and 12 (24%) other users are accessing e-journal consortia to read research articles (Figure 10).
| Service received by you | Faculty member | Percentage | Research scholar | %age | Any other | Percentage |
|---|---|---|---|---|---|---|
| Union data base (OPAC) | 10 | 50 | 15 | 50 | 18 | 36 |
| Shodhganga | 4 | 20 | 6 | 20 | 12 | 24 |
| UGC programmes | 2 | 10 | 4 | 13.3 | 8 | 16 |
| E-Journal consortia | 4 | 20 | 5 | 16.7 | 12 | 24 |
| Total | 20 | 100 | 30 | 100 | 50 | 100 |
Table 9: IBFLIBNET services received
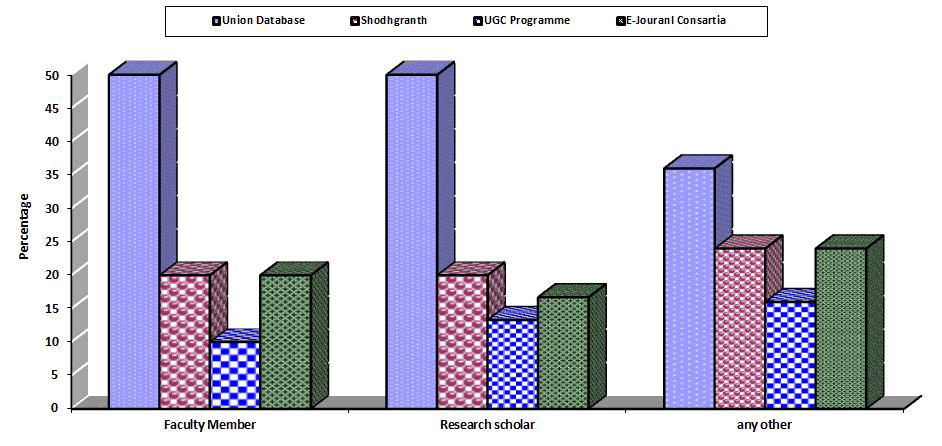
Figure 10: Figure 10 show that 10 (50%) faculty members, 15 (50%) research scholars and 18 (36%) other users are using union database (OPAC) to search books. 4 (20%) faculty members, 6 (20%) research scholars and 12 (24%) other users are availing the facility of shodhganga to pursue their research work
Table 10 shows that faculty members, research scholars and other user is using almost all services provided by INFLIBNET. 40% faculty members and research scholars like OPAC, as it provides the location of the document at national level. It not only saves the time but also the physical burden. 30% faculty members, 26% research scholars and 18% other users like shodhganga as it help the users in research work. 30% faculty members, 33% research scholars and 24% other users like to read e-journals through e-journal consortia (Figure 11).
| Learn to handle the E-resources | Faculty member | %age | Research scholar | %age | Any other | %age |
|---|---|---|---|---|---|---|
| OPAC | 8 | 40 | 12 | 40 | 29 | 58 |
| Shodhganga | 6 | 30 | 8 | 26.7 | 9 | 18 |
| E-journal | 6 | 30 | 10 | 33.3 | 12 | 24 |
| Any other please specify | 0 | 0 | 0 | 0 | 0 | 0 |
| Total | 20 | 100 | 30 | 100 | 50 | 100 |
Table 10: Which INFLIBNET services do you like?
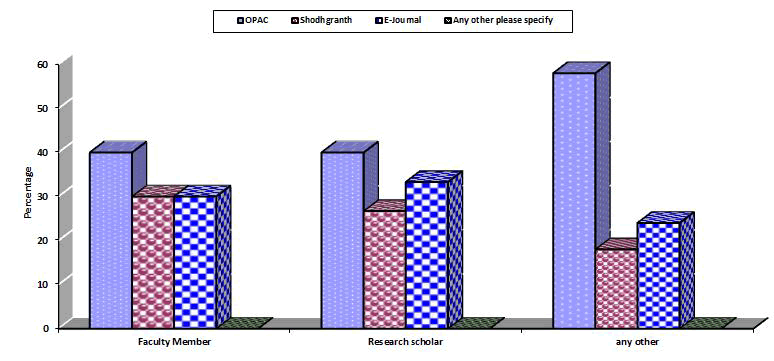
Figure 11: It shows that faculty members, research scholars and other user are using almost all services provided by INFLIBNET. 40% faculty members and research scholars like OPAC, as it provides the location of the document at national level
Table 11 shows that 7 (35%) faculty members, 13 (43.3%) research scholars and 25 (50%) other users feel that INFLIBNET services improve efficiency, whereas 6 (30%) faculty members, 5 (16%) research scholars and 12 (24%) other users feel that these type of services reduces professional work load. 3 (15%) faculty members, 5 (16%) research scholars and 8 (16%) other users use INFLIBNET services for current awareness (Figure 12).
| INFLIBNET services | Faculty member | %age | Research scholar | %age | Any other | %age |
|---|---|---|---|---|---|---|
| Improves efficiency | 7 | 35 | 13 | 43.3 | 25 | 50 |
| Reduces professional work loads | 6 | 30 | 5 | 16.7 | 12 | 24 |
| Enable to have greater access to information resources | 4 | 20 | 7 | 23.3 | 5 | 10 |
| For current awareness | 3 | 15 | 5 | 16.7 | 8 | 16 |
| Total | 20 | 100 | 30 | 100 | 50 | 100 |
Table 11: How do you feel about the INFLIBNET services
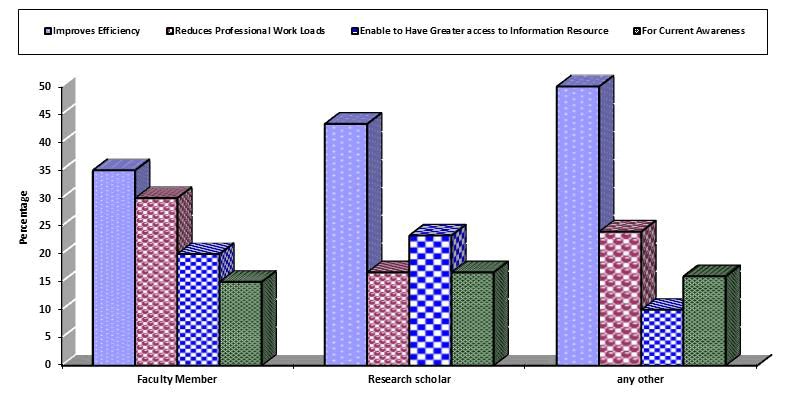
Figure 12: It shows those 7 (35%) faculty members, 13 (43.3%) research scholars and 25 (50%) other users feel that INFLIBNET services improve efficiency, whereas 6 (30%) faculty members, 5 (16%) research scholars and 12 (24%) other users feel that these type of services reduces professional work load.
Table 12 shows that majority of the users irrespective of category are unable to access e-resources due to limited number of terminals provided for the purpose. They include 80% faculty members, 53% research scholars and 58% other users. 2 (10%) faculty members, 5 (16%) research scholars and 7 (14%) other users are not using e-resources because they do not understand the procedure. 5% faculty members, 1% research scholars and 12% other users are not even aware about the service (Figure 13).
| Problem in the use of the service | Faculty member | %age | Research scholar | %age | Any other | %age |
|---|---|---|---|---|---|---|
| Limited No. of computers | 16 | 80 | 16 | 53 | 29 | 58 |
| Do not understand the process | 2 | 10 | 5 | 16 | 7 | 14 |
| Not aware of the service available | 1 | 5 | 3 | 1 | 6 | 12 |
| Needs guidance from experts | 1 | 5 | 6 | 2 | 8 | 16 |
| Total | 20 | 100 | 30 | 100 | 50 | 100 |
Table 12: Problem in the use of the service
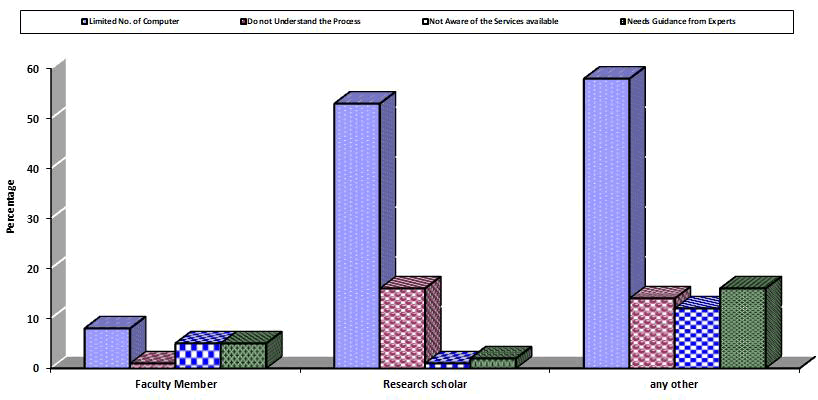
Figure 13: It shows that majority of the users irrespective of category are unable to access e-resources due to limited number of terminals provided for the purpose
Suggestion
Maximum effort should be made to move to online electronic delivery. Scanner facilities should be provided which will help to increase satisfaction level as well as speed of the service.
Most users want electronic document supply direct to their desktop. This will be quicker, cheaper and will avoid the problem of print copies being left in the library.
More terminals should be provided in university for maximum utilisation of INFLIBNET resources.
Training programmers should be organised by the library to train the users about the procedure of accessing e-resources.
User awareness programme should also be organised so that the services may be brought to the notice of those who are not aware.
Internet speed should also be improved so that more access is possible.
Conclusion
A number of benefits are being offered to member libraries of the particular networks. First, one gets access to a very large volume of literature without increase in the library budget because of the sharing of resources among the members. Secondly, the library budget can now be diverted to acquire the most important (even if expensive) information required by an institution, the other peripheral information being available on the network. Nevertheless, the growth of these networks is slow. It is taking a long time to create and provide bibliographic databases of recognisable size, without the databases neither could networks be made effective to achieve the goals nor could resource sharing be effective.
Finally it appears that prospects are quite favorable for development of networks for better information services and resource sharing in India. In this direction lot of work has to be done. Some of the problems faced by other developing countries are common to India too, including financial constraints, inadequate communication, non-availability of equipment, less awareness of the value of information, reluctance to development and non-coordination of various kind of activities, resource building, resource sharing and exchange of information and ideas, non-standardization operational procedure, lack of dedication, motivation and knowledge on the part of available manpower.
References
- Agyekum BO and Ossom S. “Awareness and impact of electronic journals usage by faculty members and lectures in kumasi polytechnic, Ghana”. Information and Knowledge Management 5.1 (2015):9-17.
- Ahmed SZ. “Use of electronic resources by the faculty members in diverse public universities in Bangladesh”. Electronic Library 31.3 (2013):290-312.
- Kumar P and Arora OP. Information and Library Network (INFLIBNET) programmer. DESIDOC Bulletin of Information Technology 16.2 (1996):11-22.
- Raghavan R and Raghavan J. Notable features of MALIBNET. DESIDOC Bulletin of Information Technology 16.2 (1996):47-56.
- Thakore SR. Ahmedabad Library Network-AD1NET. DESIDOC Bulletin of Information Technology 16.2 (1996):57-61.
- Ramesh S and Yuvaraj T. "INFLIBNET and its usage among research scholars and faculty members in universities of Tamilnadu." Library Herald 51.3 (2013):221-237.
- Singh AG and Sinha MK. "Use of electronic resources among research scholars and faculty members of university of Allahabad, Uttar Pradesh, India: A survey." Library Progress (International) 37.2 (2017):182-201.
- Madhusudhan, M. "Use of UGC‐Infonet e‐journals by research scholars and students of the University of Delhi, Delhi: A study." Library Hi Technology 26.3(2008):369-386.
- Cholin VS. "Study of the application of information technology for effective access to resources in Indian university libraries." The International Information and Library Review 37.3(2005):189-197.
Author Info
Jamal Ahmad Siddiqui* and RubiReceived: 11-Nov-2022, Manuscript No. IJLIS-22-80326; Editor assigned: 14-Nov-2022, Pre QC No. IJLIS-22-80326 (PQ); Reviewed: 29-Nov-2022, QC No. IJLIS-22-80326; Revised: 20-Feb-2023, Manuscript No. IJLIS-22-80326 (R); Published: 28-Feb-2023, DOI: 10.35248/2231-4911.23.13.842
Copyright: This is an open access article distributed under the terms of the Creative Commons Attribution License, which permits unrestricted use, distribution, and reproduction in any medium, provided the original work is properly cited.
Call for Papers
Authors can contribute papers on
What is Your ORCID
Register for the persistent digital identifier that distinguishes you from every other researcher.
Social Bookmarking
Know Your Citation Style
American Psychological Association (APA)
Modern Language Association (MLA)
American Anthropological Association (AAA)
Society for American Archaeology
American Antiquity Citation Style
American Medical Association (AMA)
American Political Science Association(APSA)


