Research Article - (2023) Volume 13, Issue 1
Global Research Output of Data Mining and Data Security: A Scientometric Study
Tayade Suraj M* and Khaparde Vaishali SAbstract
The present scientometric analysis is based on a total of 1763 articles with 273 sources (journals, books, etc.) published from 2012 to 2021. The present study attempts to measure the annual scientific publication growth, to examine the average citation, to identify most relevant sources, to identify most local cited sources (from reference lists), to identify the most relevant author, to measure country wise distribution of articles, to identify most cited countries, to identify most global cited documents, and to measure collaboration network country, attached to the articles. The most productive year period were 2018, a total (of 471) articles were published and the 2012 (16), 2013 (34), 2014 (56) are the lowest or no articles, total (1721) authors from 53 countries have contributed to the publication of articles. A complete of 1716 articles was contributed by multi-authored and 47 articles contributed by single authored. Author collaboration networks show that, authors of multi-author articles prefer cooperative analysis practices and prefer mega-author publications. Collaborative research methods show trends in large author publications. India has contributed the (368) articles.
Keywords
Bibliometric, Biblioshiny, Cyber security, Data mining, Data protection, Data security, Dimensions database, R-studio, Scientometric.
Introduction
Through this exercise we want to see that with billions of people scouring the internet every day, it is more difficult than ever to find relevant and accurate information, as we endlessly consume, create and copy data. Fortunately, we can incorporate techniques such as data mining to help sort the data so that we can better organize it and use those techniques to improve our data security. By implementing data mining and data protection, your security logs and databases can improve the detection of malware, network or system intrusions, and many other security threats as well as insider attacks, with some techniques even more accurate. In the article below you can see that research publications on the topic of data mining and data protection period between 2012 and 2021 were retrieved from dimension database [1]. The keywords "data mining and data security" were used in the subject area and the top ten researchers with the most publications were searched. A total of 1763 publications have been downloaded by dimension advanced search builder.
Scientometric
Scientometrics has been defined as the “quantitative study of science, communication in science, and science policy”. This field has evolved over time from the study of indices for improving information retrieval from peer reviewed scientific publications (commonly described as the “bibliometric” analysis of science) to cover other types of documents and information sources relating to science and technology. These sources can include data sets, web pages and social media.
There is no scientific studies are revealed on "data mining and data security" thus far, However, various scientific studies are available, which provide quantitative and analysis of world literature and many other studies.
The role of data mining in information security: Security and privacy protections have been a public policy concern for decades. However, rapid technological changes, the rapid development of the internet and electronic commerce, and the development of more sophisticated methods of collecting, analyzing and using personal information have made privacy a major public and government issue. The field of data mining is gaining significant recognition for the availability of large amounts of data, which are easily collected and stored through computer systems. Recently, the vast amount of data collected from various channels contains a lot of personal information [2]. When personal and sensitive data is published and/or analyzed, an important question to keep in mind is whether the analysis violates the privacy of the individuals whose data is referred to. The importance of information that can be used to increase revenue, cut cost, or both. Data mining software is one of many analytical tools for analyzing data. It allows users to analyze data privacy which is constantly increasing.
Data mining for security applications: In this paper we discuss the various data mining techniques that we have successfully applied for cyber security. These applications include, but are not limited to, malicious code detection by mining binary executable, network intrusion detection by mining network traffic, anomaly detection, and data stream mining. We summarize our achievements and current work at the university of Texas at Dallas on intrusion detection, and cyber security research.
Analysis of data mining literature: This study focused on the scientometric analysis of the top fifty-one cited articles in data mining. The scopus database was used to determine the citations of all published data mining articles during March 2015. The study demonstrates various aspects of data mining and was screened for top most cited publications, year wise distribution, and journal and conference citations. Authorship patterns, country wise distribution, top cited authors and their affiliations and keyword clusters. Coefficient of variation, Lotka's law and K.S. Subramaniam formula for the degree of collaboration of authors.
Data mining of scientometrics for classifying science journals: While there are many scientometrics that can be used to assess the quality of scientific work published in journals and conferences, there are nonetheless; their validity and suitability are of great concern to stakeholders, both academia and industry. Different organizations have different criteria for evaluating journals that publish scientific material. It is mostly based on information generated from scientometrics [3]. Hence there is a need for an integrated journal ranking system which is acceptable to all concerned. This paper collects data related to scientometrics for the Integrated Evaluation of Journals and proposes a mechanism of evaluation using data mining methods. In order to conduct research, the big data for proposed scientometrics is stored in a unified database. K means clustering is then applied. This is to group the journals into different unusable groups. The clusters are then labeled to find the exact rank of the science journal using a state-of-the-art technique of labeling the clusters. For new examples the classifier is trained using Naive Bayes classification model. The proposed new metrics include eigen factor, audience factor, impact factor, article influence and citation. Apart from this, Prestige of Journal (POJ) is also proposed for evaluation of the journal. The K mean clustering and Naive Bayes classification both have an accuracy of 80%. The methods can be generalized to any problem of journal classification.
In recent years, many researchers have studied statistical and scientometric analysis in various subject areas. Some of the following studies related to the objectives of this study have been reviewed in the research paper.
Source database
A data source may be the initial location where data is born or where physical information is first digitized, however even the most refined data can serve as a source, as long as another process accesses and uses it [4]. A source database is any database software with a codebase that is easy to view, download, manage, distribute, and reuse. Open source licenses give builders the freedom to create new packages using existing database technologies. A data source is the location from which the data being used comes from.
Dimensions
From the very beginning of the dimensions project, it wasn't just about creating another A and I database. Our mission is to provide new takes on research information; together, a database has been created that offers the most comprehensive collection of linked data in a single platform; from grants, publications, datasets and clinical trials to patents and policy documents. Because dimensions map the entire research lifecycle, we can follow research from output to impact. This has changed the way research is discovered, accessed and evaluated. Dimensions and the data they contain are available to the scientometric research community at no cost. Members are encouraged to extract data to develop next generation indicators. Dimensions profiles offer your organization a customized, interactive portal that efficiently displays skills and resources across your organization [5]. It is an ideal medium for promoting university developed innovations. To work effectively, researchers and organizations need a reliable and consistent source of information. Importantly, they need that source to be truly comprehensive: Looking at publications, grants, clinical trials, patents, datasets or policy documents in isolation can easily lead to erroneous conclusions.
Scope and limitation of the study
Research publications on the topic of data mining and data security spanning between 2012 and 2021 were retrieved from the dimension database. The keyword "data mining and data security" was used in the subject area and the top ten researchers with the most publications were searched. A total of 1763 publications have been downloaded by dimensions advanced search builder.

Objectives
The objectives of the present study are
•To measure the annual scientific publication growth.
•To examine the average citation.
•To identify most relevant sources.
•To identify most local cited sources (from reference lists).
•To identify the most relevant author.
•To measure country wise distribution of articles.
•To identify most cited countries.
•To identify most global cited documents.
•To measure collaboration network country.
Materials and Methods
Research publications were obtained from the dimensions database on the subject of data mining and data security scattered between 2012 and 2021. The keyword 'data mining and data security' was explored in the subject area [6]. Out of a total of 1763 publications were downloaded and the same publications were analyzed using VOS viewer, Microsoft Excel and R-based R-Studio with Biblioshiny software for the purpose of the study.
Research publications were obtained from dimension database on the topic of data mining and data security scattered between 2012 and 2021. The keyword 'data mining and data security' was searched in the subject area. A total of 1763 publications were downloaded and the same publications were analyzed using Biblioshiny software with VOS viewer, Microsoft excel and R-based R-Studio for the purpose of the study (Table 1).
| Search free text in full data filter | Data mining and data security |
| (Top ten authors) | Kim-Kwang Raymond Choo OR Mohsen Mokhtar uizani OR Iztok Podbregar OR Heinz Mehlhorn OR Neeraj Kumar OR Roger J R evesque OR Laurence Tianruo Yang OR Yang Xiang OR Hai Jin OR Polona Sprajc olona Sprajc |
| Publication year | 2021 OR 2020 OR 2019 OR 2018 OR 2017 OR 2016 OR 2015 OR 2014 OR 2013 OR 2012 |
Table 1: Bibliographic data
The extracted descriptive bibliographic data was exported from the source database in bib format and downloaded to PC. Data were prepared and validated using MS Excel. The resulting data were analyzed with R-based R-Studio, Biblioshiny software, widely used open source software for comprehensive bibliographic analysis available on the web [7]. For network visualization, we have installed VOS viewer for MS Windows.
Results and Discussion
Data analysis and results
An analysis of the collected data has led to several interesting findings that reflect the scholarly qualities of the source journal.
There is observed from the analysis of the collected data has yielded many interesting findings that reflect the scholarly qualities of the source journal (Table 2). As in 2012-2021, sources (273), documents (1763), authors (1721), average years from publication (4.06), average citations per documents (26.64), average citations per year per doc (5.349), references (31246) authors of single-authored documents (47), authors of multi-authored documents (1716), collaboration index (1.26) were seen throughout the years.
| Description | Results |
|---|---|
| Main information about data | |
| Time span | 2012:2021 |
| Sources (journals, books, etc.) | 273 |
| Documents | 1763 |
| Average years from publication | 4.06 |
| Average citations per documents | 26.64 |
| Average citations per year per doc | 5.349 |
| References | 31246 |
| Document types | |
| article | 1763 |
| Authors | |
| Authors | 1721 |
| Author Appearances | 7205 |
| Authors of single authored documents | 47 |
| Authors of multi-authored documents | 1716 |
| Authors collaboration | |
| Single authored documents | 401 |
| Documents per author | 1.02 |
| Authors per document | 0.976 |
| Co-authors per documents | 4.09 |
| Collaboration index | 1.26 |
Table 2: Main Information about the collection
This can be seen from 2018 was found to have a majority of 471 (26.72 %) contributions out of a total of 1763 contributions 2012 (16) (0.91%), 2013 (34) (1.93%), 2014 (56) (3.18%), 2015 (67) (3.80%) had minimal contributions (Table 3 and Figure 1).
| Year | Articles | % |
|---|---|---|
| 2012 | 16 | 0.91 |
| 2013 | 34 | 1.93 |
| 2014 | 56 | 3.18 |
| 2015 | 67 | 3.8 |
| 2016 | 273 | 15.48 |
| 2017 | 169 | 9.59 |
| 2018 | 471 | 26.72 |
| 2019 | 238 | 13.5 |
| 2020 | 251 | 14.24 |
| 2021 | 188 | 10.66 |
| Total | 1763 | 100 |
Table 3: Average citation per year
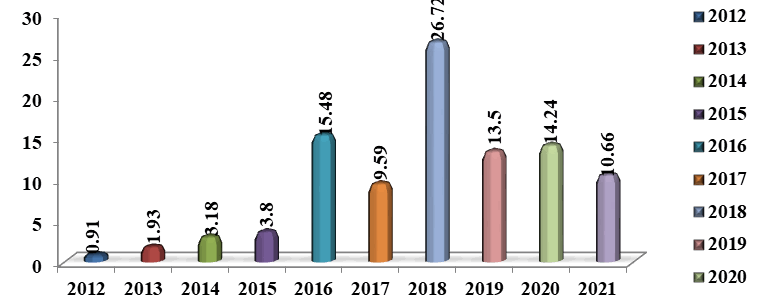
Figure 1: Average citation per year
Table 4 and Figure 2 have been observed Annual scientific growth of publications in the source journal during the period 2012 to 2021. Total 1763 articles have been published; it is observed a significant growth in the number of articles (471) which is highest as compared to the articles published during 2018 [8]. The mean total citation per art (104.91) highest in the year 2015 and The Mean TC per Year (14.99) highest in the year 2015.
| Year | N | Mean TC per art | Mean TC per year | Citable years |
|---|---|---|---|---|
| 2012 | 16 | 41.44 | 4.14 | 10 |
| 2013 | 34 | 56.82 | 6.31 | 9 |
| 2014 | 56 | 68.29 | 8.54 | 8 |
| 2015 | 67 | 104.91 | 14.99 | 7 |
| 2016 | 273 | 15.33 | 2.55 | 6 |
| 2017 | 169 | 32.51 | 6.5 | 5 |
| 2018 | 471 | 18.17 | 4.54 | 4 |
| 2019 | 238 | 32.77 | 10.92 | 3 |
| 2020 | 251 | 24.87 | 12.43 | 2 |
| 2021 | 188 | 6.57 | 6.57 | 1 |
| Total | 1763 | - | - | 55 |
Table 4: Average citations per year
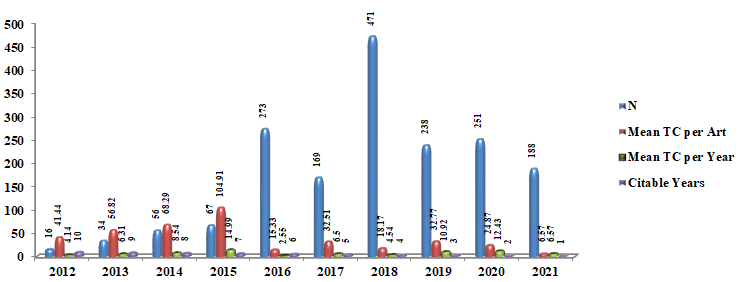
Figure 2: Average citations per year
Table 5 and Figure 3 shows the top twenty authors who wrote at least articles in the source journal during the analyzed period. The most relevant sources was encyclopedia of parasitology (192), followed by encyclopedia of adolescence (170), IEEE access (126), Organizacija In Negotovosti V Digitalni Dobi/Organization and uncertainty in the digital age (99), future generation computer systems (76).
| Sr. No. | Sources | Articles |
|---|---|---|
| 1 | Encyclopedia of parasitology | 192 |
| 2 | Encyclopedia of adolescence | 170 |
| 3 | IEEE access | 126 |
| 4 | Organizacija In negotovosti V digitalni dobi/organization And Uncertainty In the digital age | 99 |
| 5 | Future generation computer systems | 76 |
| 6 | IEEE internet of things journal | 65 |
| 7 | 38. Mednarodna konferenca O razvoju organizacijskih znanosti: Ekosistem organizacij V dobi digitalizacije: konferencni zbornik | 50 |
| 8 | Odgovorna organizacija / Responsible organization | 39 |
| 9 | IEEE transactions on industrial informatics | 33 |
| 10 | Lecture notes in computer science | 32 |
| 11 | 1 Sources are relevant 29 times | 29 |
| 12 | 2 Sources are relevant 28 times | 56 |
| 13 | 1 Sources are relevant 22 times | 22 |
| 14 | 1 Sources are relevant 21 times | 21 |
| 15 | 1 Sources are relevant 20 times | 20 |
| 16 | 1 Sources are relevant 18 times | 18 |
| 17 | 1 Sources are relevant 17 times | 17 |
| 18 | 1 Sources are relevant 16 times | 16 |
| 19 | 4 Sources are relevant 15 times | 60 |
| 20 | 3 Sources are relevant 14 times | 42 |
| 21 | 3 Sources are relevant 13 times | 39 |
| 22 | 1 Sources are relevant 12 times | 12 |
| 23 | 2 Sources are relevant 11 times | 22 |
| 24 | 3 Sources are relevant 10 times | 30 |
| 25 | 1 Sources are relevant 9 times | 9 |
| 26 | 2 Sources are relevant 8 times | 16 |
| 27 | 3 Sources are relevant 7 times | 21 |
| 28 | 6 Sources are relevant 6 times | 36 |
| 29 | 8 Sources are relevant 5 times | 40 |
| 30 | 12 Sources are relevant 4 times | 48 |
| 31 | 26 Sources are relevant 3 times | 78 |
| 32 | 49 Sources are relevant 2 times | 98 |
| 33 | 131 Sources are relevant 1 times | 131 |
Total |
1763 |
|
Table 5: Most relevant sources
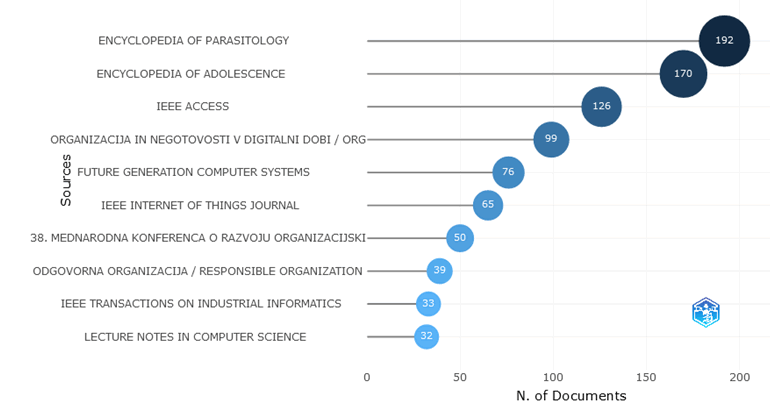
Figure 3: Most relevant sources
Table 6 and Figure 4 observed that most local cited sources (from reference lists), the most local cited sources (from reference lists) in the source journal during the analyzed period is lecture notes in computer science (2423), Followed by IEEE access (1111), future generation computer systems (816) shows in total number of reference of 31246.
| Sr. No. | Sources | Articles |
|---|---|---|
| 1 | Lecture notes in computer science | 2423 |
| 2 | IEEE access | 1111 |
| 3 | Future generation computer systems | 816 |
| 4 | IEEE internet of things journal | 726 |
| 5 | IEEE communications surveys & tutorials | 541 |
| 6 | IEEE communications magazine | 536 |
| 7 | IEEE transactions on industrial informatics | 495 |
| 8 | IEEE transactions on parallel and distributed systems | 458 |
| 9 | Digital investigation | 446 |
| 10 | Journal of network and computer applications | 444 |
Table 6: Most local cited sources (from reference lists)
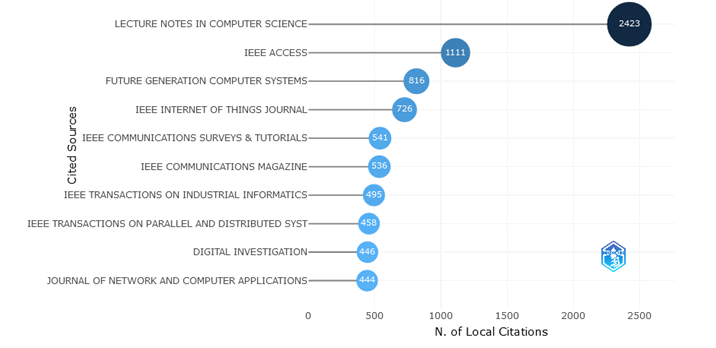
Figure 4: Most local cited sources (from reference lists)
Table 7 and Figure 5 show the most relevant authors in the source journal during the analyzed period. The most relevant authors was CHOO KR 331 (79.74%), followed by GUIZANI M 221 (41.82%), PODBREGAR I 194 (70.58%) of China and US are included.
| Sr. No. | Authors | Articles | Articles fractionalized |
|---|---|---|---|
| 1 | Choo KR | 331 | 79.74 |
| 2 | Guizani M | 221 | 41.82 |
| 3 | Podbregar I | 194 | 70.58 |
| 4 | Mehlhorn H | 193 | 193 |
| 5 | Kumar N | 190 | 45.76 |
| 6 | Xiang Y | 171 | 36.11 |
| 7 | Levesque RJR | 170 | 170 |
| 8 | Yang LT | 169 | 35.07 |
| 9 | Jin H | 165 | 34.92 |
| 10 | Šprajc P | 158 | 35.97 |
Table 7: Most relevant authors
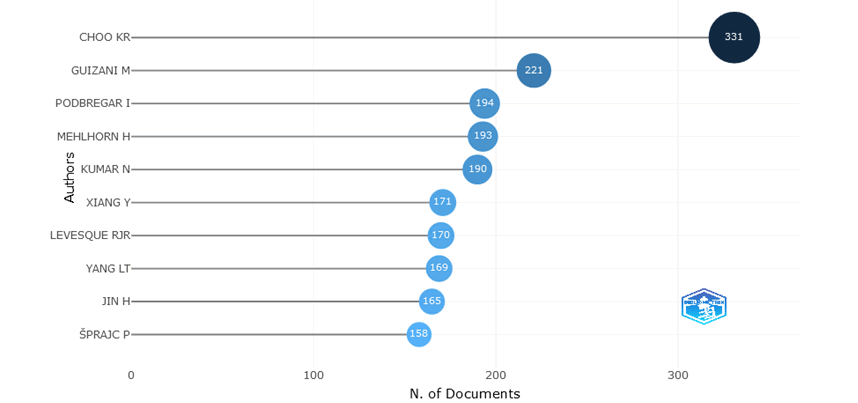
Figure 5: Most relevant authors
Table 8 and Figure 6 observed that the most productive top ten countries, China has produced highest 1107 (15.4%) papers followed by Australia 428 (5.94%), India 368 (5.11%), Canada 215 (2.98%), Germany 197 (2.73%) respectively these countries are included [9].
| Sr. No. | Region | Freq | % |
|---|---|---|---|
| 1 | China | 1107 | 15.4 |
| 2 | Australia | 428 | 5.94 |
| 3 | India | 368 | 5.11 |
| 4 | Canada | 215 | 2.98 |
| 5 | Germany | 197 | 2.73 |
| 6 | Qatar | 145 | 2.01 |
| 7 | Saudi Arabia | 116 | 1.61 |
| 8 | Uk | 110 | 1.53 |
| 9 | Taiwan | 91 | 1.26 |
| 10 | Japan | 54 | 0.75 |
| 11 | 1 Regions are relevant 50 times | 50 | 0.69 |
| 12 | 1 Regions are relevant 43 times | 43 | 0.6 |
| 13 | 2 Regions are relevant 35 times | 70 | 0.97 |
| 14 | 1 Regions are relevant 23 times | 23 | 0.32 |
| 15 | 1 Regions are relevant 22 times | 22 | 0.31 |
| 16 | 1 Regions are relevant 20 times | 20 | 0.28 |
| 17 | 1 Regions are relevant 19 times | 19 | 0.26 |
| 18 | 1 Regions are relevant 18 times | 18 | 0.25 |
| 19 | 1 Regions are relevant 17 times | 17 | 0.24 |
| 20 | 2 Regions are relevant 13 times | 26 | 0.36 |
| 21 | 2 Regions are relevant 12 times | 24 | 0.33 |
| 22 | 1 Regions are relevant 11 times | 11 | 0.15 |
| 23 | 1 Regions are relevant 10 times | 10 | 0.14 |
| 24 | 2 Regions are relevant 9 times | 18 | 0.25 |
| 25 | 1 Regions are relevant 7 times | 7 | 0.1 |
| 26 | 2 Regions are relevant 6 times | 12 | 0.17 |
| 27 | 2 Regions are relevant 5 times | 10 | 0.14 |
| 28 | 1 Regions are relevant 4 times | 4 | 0.06 |
| 29 | 5 Regions are relevant 3 times | 15 | 0.21 |
| 30 | 6 Regions are relevant 2 times | 12 | 0.17 |
| 31 | 8 Regions are relevant 1 times | 8 | 0.11 |
| N/A | 3935 | 54.6 | |
| Total | 7205 | 100 |
Table 8: Country scientific production
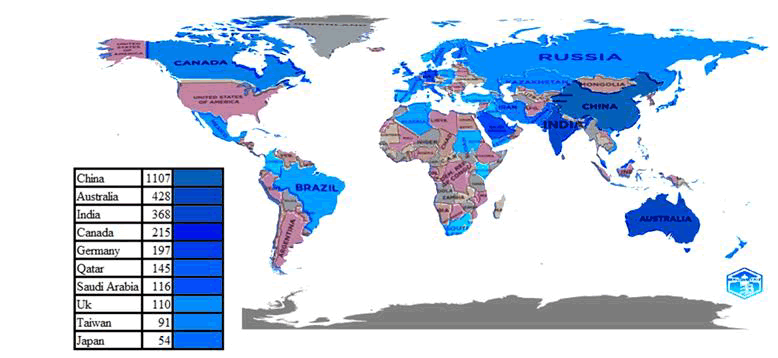
Figure 6: Country scientific production
Table 9 and Figure 7 shows the out of 40 most cited top ten countries, China has most cited country 16726 (35.61%), followed by United States 6967 (14.83%), India 6528 (13.90%), Australia 5252 (11.18%), Iran 1294 (2.76%), respectively these countries are included [10].
| Sr. No. | Country | Total citations | % |
|---|---|---|---|
| 1 | China | 16726 | 35.61 |
| 2 | United States | 6967 | 14.83 |
| 3 | India | 6528 | 13.9 |
| 4 | Australia | 5252 | 11.18 |
| 5 | Iran | 1294 | 2.76 |
| 6 | Canada | 1265 | 2.69 |
| 7 | Jordan | 1104 | 2.35 |
| 8 | United Kingdom | 1005 | 2.14 |
| 9 | Pakistan | 969 | 2.06 |
| 10 | Saudi Arabia | 968 | 2.06 |
| 11 | Na | 843 | 1.79 |
| 12 | Malaysia | 798 | 1.7 |
| 13 | Qatar | 642 | 1.37 |
| 14 | Taiwan | 493 | 1.05 |
| 15 | South Africa | 416 | 0.89 |
| 16 | Singapore | 363 | 0.77 |
| 17 | Japan | 282 | 0.6 |
| 18 | South Korea | 255 | 0.54 |
| 19 | United Arab Emirates | 186 | 0.4 |
| 20 | Ireland | 92 | 0.2 |
| 21 | Sudan | 89 | 0.19 |
| 22 | Portugal | 85 | 0.18 |
| 23 | Algeria | 47 | 0.1 |
| 24 | France | 38 | 0.08 |
| 25 | Mexico | 38 | 0.08 |
| 26 | Vietnam | 37 | 0.08 |
| 27 | Hungary | 36 | 0.08 |
| 28 | Iraq | 34 | 0.07 |
| 29 | Slovenia | 22 | 0.05 |
| 30 | Croatia | 19 | 0.04 |
| 31 | Italy | 17 | 0.04 |
| 32 | Sweden | 16 | 0.03 |
| 33 | Russia | 11 | 0.02 |
| 34 | Spain | 9 | 0.02 |
| 35 | Germany | 7 | 0.01 |
| 36 | Turkey | 4 | 0.01 |
| 37 | Tunisia | 3 | 0.01 |
| 38 | Greece | 2 | 0 |
| 39 | Lebanon | 1 | 0 |
| 40 | Poland | 1 | 0 |
| Total | 46964 | 100 |
Table 9: Most cited countries
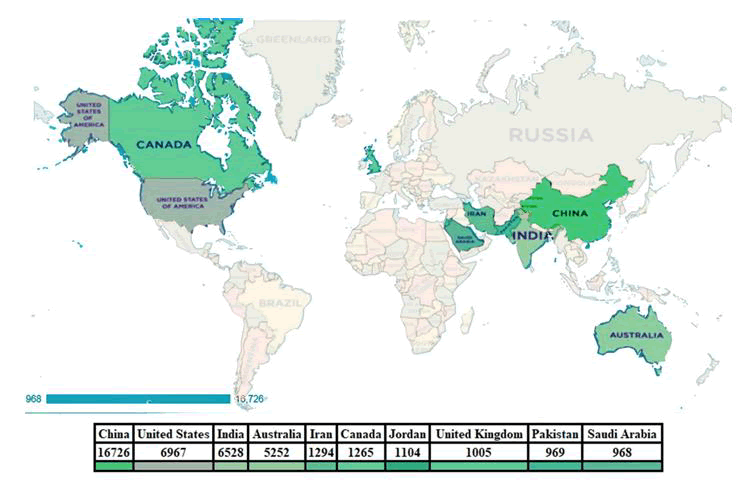
Figure 7: Most cited countries
Table 10 and Figure 8 observed that most global cited documents, AL-FUQAHA A, 2015, IEEE communications surveys and tutorials has most cited documents 4492 TC per year 561.50 normalized TC 42.82, followed by Shakhatreh H, 2019, IEEE Access 751 TC per Year 187.75 normalized TC 22.92, Mohammadi M, 2018, IEEE communications surveys and tutorials 663 TC per year 132.60 normalized TC 36.48. These documents appear to be included respectively.
| Sr. No. | Paper | DOI | Total Citations | TC per Year | Normalized TC |
|---|---|---|---|---|---|
| 1 | AL-Fuqaha A, 2015, IEEE communications surveys and tutorials | 10.1109/COMST.2015.2444095 | 4492 | 561.5 | 42.82 |
| 2 | Shakhatreh H, 2019, IEEE Access | 10.1109/ACCESS.2019.2909530 | 751 | 187.75 | 22.92 |
| 3 | Mohammadi M, 2018, IEEE communications surveys and tutorials | 10.1109/COMST.2018.2844341 | 663 | 132.6 | 36.48 |
| 4 | Zhang Q, 2018, Information fusion | 10.1016/J.INFFUS.2017.10.006 | 592 | 118.4 | 32.57 |
| 5 | XIA Q, 2017, IEEE access | 10.1109/ACCESS.2017.2730843 | 563 | 93.83 | 17.32 |
| 6 | KHAN WZ, 2013, IEEE communications surveys and tutorials | 10.1109/SURV.2012.031412.00077 | 420 | 42 | 7.39 |
| 7 | TSAI C, 2014, IEEE communications surveys and tutorials | 10.1109/SURV.2013.103013.00206 | 414 | 46 | 6.06 |
| 8 | YAQOOB I, 2017, IEEE wireless communications | 10.1109/MWC.2017.1600421 | 367 | 61.17 | 11.29 |
| 9 | LI J, 2014, IEEE transactions on parallel and distributed systems | 10.1109/TPDS.2013.271 | 331 | 36.78 | 4.85 |
| 10 | LI J, 2018, computers & security | 10.1016/J.COSE.2017.08.007 | 330 | 66 | 18.16 |
Table 10: Most global cited documents
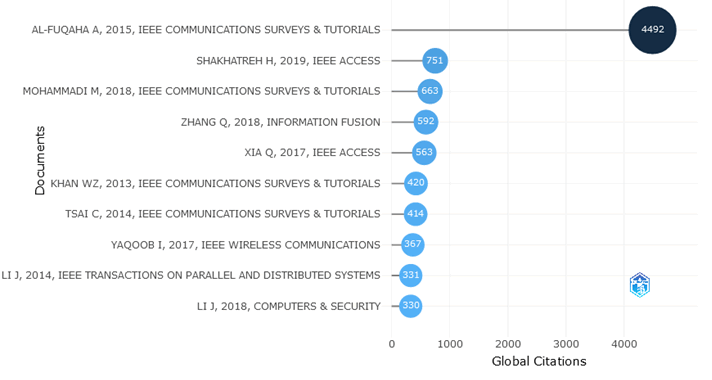
Figure 8: Most global cited documents
Table 11 and Figure 9 Shows that the out of 43 collaboration network country, China has highest collaborative country (0.18), followed by United States (0.15), Australia (0.08), Canada (0.06). These countries appear to be included respectively.
| Sr. No. | Node | Cluster | Betweenness | Closeness | Page rank |
|---|---|---|---|---|---|
| 1 | China | 1 | 266.65 | 0.02 | 0.18 |
| 2 | United States | 1 | 232.65 | 0.02 | 0.15 |
| 3 | Australia | 1 | 66.08 | 0.02 | 0.08 |
| 4 | Canada | 1 | 36.37 | 0.02 | 0.06 |
| 5 | Germany | 1 | 0 | 0.01 | 0 |
| 6 | Qatar | 1 | 40.54 | 0.02 | 0.05 |
| 7 | United Kingdom | 1 | 12.46 | 0.02 | 0.04 |
| 8 | Japan | 1 | 0.04 | 0.01 | 0.02 |
| 9 | Singapore | 1 | 0 | 0.01 | 0.02 |
| 10 | Iran | 1 | 0 | 0.01 | 0.01 |
| 11 | Finland | 1 | 0 | 0.01 | 0.01 |
| 12 | Italy | 1 | 0.31 | 0.01 | 0.01 |
| 13 | Ireland | 1 | 0.23 | 0.01 | 0.01 |
| 14 | Norway | 1 | 0 | 0.01 | 0.01 |
| 15 | Sweden | 1 | 0.04 | 0.01 | 0.01 |
| 16 | France | 1 | 0 | 0.01 | 0.01 |
| 17 | Iraq | 1 | 0 | 0.01 | 0 |
| 18 | Mexico | 1 | 0 | 0.01 | 0 |
| 19 | Denmark | 1 | 0 | 0.01 | 0.01 |
| 20 | New Zealand | 1 | 0 | 0.01 | 0.01 |
| 21 | Netherlands | 1 | 0 | 0.01 | 0.01 |
| 22 | Algeria | 1 | 0 | 0.01 | 0 |
| 23 | Estonia | 1 | 0 | 0.01 | 0 |
| 24 | Lebanon | 1 | 0 | 0.01 | 0 |
| 25 | South Africa | 1 | 0 | 0.01 | 0 |
| 26 | Yemen | 1 | 0 | 0.01 | 0 |
| 27 | Fiji | 1 | 0 | 0.01 | 0 |
| 28 | Poland | 1 | 0 | 0.01 | 0 |
| 29 | India | 2 | 116.79 | 0.02 | 0.07 |
| 30 | Saudi Arabia | 2 | 12.27 | 0.02 | 0.05 |
| 31 | Taiwan | 2 | 0.35 | 0.01 | 0.03 |
| 32 | Pakistan | 2 | 3.39 | 0.01 | 0.02 |
| 33 | South Korea | 2 | 0.32 | 0.01 | 0.02 |
| 34 | Brazil | 2 | 1.33 | 0.01 | 0.02 |
| 35 | Malaysia | 2 | 0.17 | 0.01 | 0.01 |
| 36 | Portugal | 2 | 2.53 | 0.01 | 0.02 |
| 37 | Jordan | 2 | 0.39 | 0.01 | 0.01 |
| 38 | Spain | 2 | 0 | 0.01 | 0.01 |
| 39 | United Arab Emirates | 2 | 0 | 0.01 | 0.01 |
| 40 | Russia | 2 | 0 | 0.01 | 0.01 |
| 41 | Vietnam | 2 | 0.03 | 0.01 | 0.01 |
| 42 | Kazakhstan | 2 | 0.04 | 0.01 | 0.01 |
| 43 | Slovakia | 2 | 0 | 0.01 | 0 |
Table 11: Collaboration network country
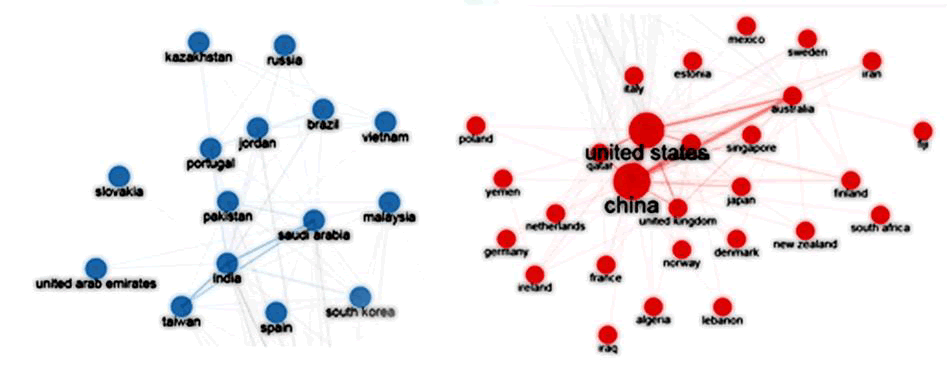
Figure 9: Collaboration network country
Conclusion
The current scientometric study shows that a total of 1763 articles on data mining and data protection were published in the dimension database during 2012 to 2021. The keywords "data mining and data security" were used in the subject area and searched the most publications with the top ten researchers. Out of the total 1763 contributions in the year 2018, 471 are the majority, with the significant increase in the number of articles being the highest in the number of articles published during 2018. Top 20 authors who have written the most articles in Source. The most relevant authors was Choo KR, and further the most relevant source is the Encyclopedia of Parasitology, just as the most locally cited sources (from reference lists) in the source journal during the period of analysis are lecture notes in computer science. The most productive of the ten countries out of 40, i.e. China produced the most papers, and if you look at the top ten most cited countries, i.e. China is the most cited country, the most cited global document which is Al-Fukaha A, 2015 is the most cited document in the IEEE communications survey and tutorials, see the end cooperation network country out of 43 China is the highest ally.
The present study provides guidance to researchers in the field of 'data mining and data security' to get information about trends in topic development, topics and sources to publish their research work to gain global recognition.
References
- Aggarwal A, et al. “Scientometric analysis of medical publications during COVID-19 pandemic: the twenty-twenty research boom’’. Minerva Medica 112.5 (2021): 631-640.
[Crossref] [Google Scholar] [PubMed]
- Aria M, Misuraca M and Spano M. “Mapping the Evolution of Social Research and Data Science on 30 Years of Social Indicators Research”. Social Indicators Research 149.3 (2020):803–831.
- Nisha F, Hussain A and Senthil A. “Scientometric Analysis of Data Mining Literature.” 2015. [Google Scholar]
- Martinez P, Al-Hussein M and Ahmad R. “A scientometric analysis and critical review of computer vision applications for construction.” Automation in Construction 107 (2015):102947.
- Niranjan A and Nitish A. “C Software and Data Engineering.” Global Journal of Computer Science and Technology 16.5 (2016):23.
- Osman A. “The role of data mining in information security.” International Journal of Computer (IJC) 21. (2016).
- Shaheen M, Ahsan A and Iqbal S. “data mining of scientometrics for classifying science journals.” Intelligent Automation and Soft Computing 28.3 (2021):873–885.
[Crossref]
- Tayade S. “Scientometric analysis of mapping of sensors a study based on web of science database.” International Journal of Classified Research Techniques and Advances (IJCRTA) 2.1:14.
- Tayade S. “Scientometric analysis: library quarterly.” An International Peer Reviewed Bilingual E-Journal of Library and Information Science 2.1 (2015):28.
- Thuraisingham B. “Data Mining for Security Applications.” International Conference on Embedded and Ubiquitous Computing 6. (2008):585-589.
Author Info
Tayade Suraj M* and Khaparde Vaishali SReceived: 19-Sep-2022, Manuscript No. IJLIS-22-76247; Editor assigned: 22-Sep-2022, Pre QC No. IJLIS-22-76247(PQ); Reviewed: 06-Oct-2022, QC No. IJLIS-22-76247; Revised: 23-Dec-2022, Manuscript No. IJLIS-22-76247(R); Published: 03-Jan-2023, DOI: 10.35248/2231-4911.23.13.841
Copyright: This is an open access article distributed under the terms of the Creative Commons Attribution License, which permits unrestricted use, distribution, and reproduction in any medium, provided the original work is properly cited.
Call for Papers
Authors can contribute papers on
What is Your ORCID
Register for the persistent digital identifier that distinguishes you from every other researcher.
Social Bookmarking
Know Your Citation Style
American Psychological Association (APA)
Modern Language Association (MLA)
American Anthropological Association (AAA)
Society for American Archaeology
American Antiquity Citation Style
American Medical Association (AMA)
American Political Science Association(APSA)


