
Research Article - (2022) Volume 12, Issue 3
Extensiveness of ICT Skills Possessed by Faculty Members of Science and Technology in Accessing and Using E-resources in Kuvempu and Davangere Universities, Karnataka State, India
Hemesha H. N1* and Santhosh Kumar K. T2*Abstract
The study focused on level of competency possessed by the faculty members of science and technology in using e-resources in the universities of Karnataka. The investigator had chosen two universities for the survey namely Kuvempu University and Davangere University. The study intended to explore faculty competency level in using e-resources, their preferences over devices, type of e-resources, search engines, file formats to access e-resources and also emphasizes on search strategies used to access e-resources, constraints faced and about which are the areas faculty members need training to use eresources effectively. The study involves 128 respondents from both the universities with the response rate of 93.43%. The results of the study reveals that majority of faculty members extensively using e-journals followed by online databases and using e-resources more for research purpose followed by class room instruction. They opined that they have good competence in using e-resources and most of them using laptops to access e-resources and agreed strongly that they needed further training to optimizing the use eresources.
References
Stone Market in California Stone Market in Texas Stone Market in Nevada Stone Market in Georgia Stone Market in Michigan Stone Market in WyomingKeywords
Information and Communication Technology (ICT), ICT competency, E-resources, Information literacy.
Introduction
E-resources are got more importance and also rapid increase in its usage in recent times, due to various reasons like ease to access, search ability, multiple access facility, archival facility and many more and with this one more reason added in recent time that is COVID-19 pandemic situation. It forced people to stay in home and isolated them from neighbors, relatives, friends and of course with workplace. Academicians and students not exempted from this, they are unable to access physical resources available at university and colleges and all are engaged in online for teaching and learning purpose. Hence the use of electronic resources increased enormously and the situation forced the teaching professionals who are not using e-resources before to access information through online. Information and Communication Technology (ICT) influenced higher education in a bigger way and in other hand higher education sector also adopting ICTs in teaching and learning activities and it is increased in COVID-19 period and after that. At the same time teachers needs to build the competence in using ICT devices and applications to access e-resources. To use e-resources effectively faculty members should get competence in ICT. Hence, the present study emphasized on ICT skills possessed by faculty members to access and use of e-resources. The study involves faculty members of science technology who are working in Kuvempu University and Davangere University in Karnataka, India (Zare-Ee A, 2011).
Review of Literature
Investigator has studied previous similar studies to understand the ways the studies are being conducted by different researchers in the past and results of previous studies helps investigator to execute the present study in the right way. Here, Investigator tried to accumulate some of the useful previous literature on Use of e-resources by faculty/staff members of the universities (Srinivasulu, et al., 2019).
Sivakami and Rajendran investigated the awareness, access and usage of e-resources among faculty members in Arts and Science Colleges at Erode (Sivakami and Rajendran, 2019). The results of the study showed that the majority of the faculty members 88 (31.43%) are using the e-resources for the purpose of giving lecture notes. They have accessed e-resources for their study and research purpose. It is revealed from the study by Palikiti, et al., the majority of the faculty members of Vardhaman College of Engineering, Hyderabad use the e-resources to enhance their teaching and research activities and the study also noticed that e-resources of library are playing important role of functioning of any academic and research institution (Palikiti, et al., 2019).
Lakpathi et al., exhibits form their study is that majority of the research scholars of Osmania University use pattern of e-resources is read findings and conclusion (Lakpathi, et al., 2019). The study also highlighted that major problems in accessing electronic resources are irrelevant information, huge number of hits and network connectivity. The respondents expressed that hands on experience training is required to maximum utility of electronic resources.
Girakaduwa noticed from his study on Usage of Electronic Resources, Services and Challenges faced by the Library users in University of the Visual and Performing arts (UVPA), Sri Lanka is that continuous curriculum revisions are needed with more practical and hands-on sessions (Girakaduwa S, 2019). Furthermore, library should play active role by commencing well-planned user awareness and user education programs on e-resources and developing infrastructure facilities and subscribing more e-resources to the University library.
A study by Shashikala and Srinivasaragavan which revealed that most of the teaching faculty and PG students preferred to search Google and Yahoo as search engine for their information search requirements and they have visited Pub Med, Science Direct and Ovid publisher’s journal databases to access E-resources (Shashikala & Srinivasaragavan, 2019). It is concluded from the study is that use of web-based use of E-resources has tremendous impact on the academic performance of the Postgraduate Students & Teaching faculties and also provides curriculum support to students for whom physical access to the library is difficult and time consuming.
The study conducted by Esh (2019) on Usage of e-journals in University of North Bengal (Esh, 2019). The results of the study exhibits that Science Direct has the maximum use 55% among faculty members. Akuffo and Budu studied on Use of electronic resources by students in a premier postgraduate theological university in Ghana, which revealed that most of the respondents have inadequate search skills it is mainly due to lack of training and study found that access problems, search and retrieval problems and staff-related problems were the major constraints to use e-resources among students (Akuffo & Budu, 2019).
Soni et al., have mentioned in their study is that ‘Shodhganga’ was mostly used by LIS research scholars of Jiwaji University, followed by DOAJ and study also identified that research scholars got information about available E-resources and databases in their institute through the library website, followed by searching on Internet (Soni, et al., 2018). The results of the study by Ahmed and Al-Reyaee showed that overall knowledge and use of e-databases by medical students of Al-Jouf University in Saudi Arabia was much higher than the dental students (Ahmed & Al-Reyaee, 2017). It is evident from the study; the lack of useful eresources for dental students is the main reason for them to record low response. A similar study by Barman on Knowledge and use of E-Resources by faculty and research students at the Dibrugarh University, Assam, which exhibits that majority of respondents are aware about the e-resources available in the university library (Barman, 2016). The respondents expressed that E-resources are inevitable tool for them in teaching, learning and research process. The study also revealed that around 50% of the faculty members use the e-resources for the purpose of preparation of their classes whereas 32.55% of the research scholars access the e-resources in order to gain current awareness. It is reported from the similar study conducted by the Kashyap is that use of information and communication technology in the form of e-resources by faculty Members working in universities operational in Chhattisgarh is significantly better as compared to faculty members working in universities operational in Madhya Pradesh (Kashyap, et al., 2016). The study suggested that more in-depth study in future is the need of the hour, so that causes of lesser use of e-resources by university faculty members of Madhya Pradesh can be determined.
Objectives of the study
The main objectives of the study are:
• To assess the ICT skills possessed by Faculty members to access and use of eresources.
• To find the competence level of Faculty members in using ICT devices and its applications to access e-resources.
• To know the extensiveness of usage of different kind of e-resources among Faculty members.
• To know the constraints in acquiring ICT competency skills by faculty members to access and use of e-resources.
Methodology
In this study survey method has been adopted for investigation, a well-structured questionnaire is designed and it is based on objectives of the study. The questionnaire consist of 36 unique questions and it is divided in to 5 sections such as Demographic details, Use of E-Resources, Search Engine and Search Strategies, Competency in Application/Utilization of E-Resources, Attitude towards Application/Utilization of E-Resources, which helped researcher to get authenticated information from respondents (Borgohain, et al., 2017). The study covered two universities in the state of Karnataka, India, such as Kuvempu University and Davangere University and total strength of the faculty members in the science and technology stream in the above universities is 137, questionnaires distributed physically by giving printed copies and also used google forms to collect the data (Table 1).
| Name of the University | Total Faculty Strength in Science and Technology Stream | No. of responses received |
|---|---|---|
| Kuvempu University | 63 | 60 |
| Davangere University | 74 | 68 |
| Total | 137 | 128 |
| Response rate | 93.43% | |
Table 1: Total Faculty Strength in Science and Technology
As table denotes the questionnaire distributed to all 137 faculty members and received 128 filled questionnaires and the response rate is 93.43%. The data so collected has been tabulated and analyzed with interpretation and also given some constructive recommendations.
Results and Discussion
Analysis
Gender and age-wise distribution of respondents : The table denotes male faculty members dominates female in number i.e. 100 (78.1%) male respondents and 28 (21.9%) female respondents are there in the both universities and majority of respondents (97) age lies between 31 - 50 years. It reveals that both the universities have young faculty members in science and technology and they are open to contemporary technological changes (Table 2).
| N=128 | ||
|---|---|---|
| Gender | Frequency | Percent |
| Male | 100 | 78.1 |
| Female | 28 | 21.9 |
| Total | 128 | 100 |
| N=128 | ||
| Age in years | Frequency | Percent |
| <=30 | 8 | 6.3 |
| 31-40 | 50 | 39.1 |
| 41-50 | 47 | 36.7 |
| 51-60 | 22 | 17.2 |
| 61 and above | 1 | 0.8 |
| Total | 128 | 100 |
Table 2: Gender and Age-wise Distribution of Respondents
Qualification and designation wise distribution of respondents : It is observed from the table is that the 75% of faculty members have Ph.D. degree and 15.6% respondents are Postdoctorates. The table also shows that 50.8% of faculty members are Asst. Professors followed by 25.8% of Associate professors and 23.4% are Professors. The table reveals that faculty members are highly qualified and majority of them are young faculties working as Assistant and Associate Professors (Table 3).
| N=128 | ||
|---|---|---|
| Qualification | Frequency | Percent |
| Post Doctorate | 20 | 15.6 |
| Doctorate (Ph.D.) | 96 | 75 |
| M.Phil. | 2 | 1.6 |
| PG | 10 | 7.8 |
| Total | 128 | 100 |
| N=128 | ||
| Designation | Frequency | Percent |
| Professor | 30 | 23.4 |
| Associate Professor | 33 | 25.8 |
| Assistant Professor | 65 | 50.8 |
| Total | 128 | 100 |
Table 3: Qualification and Designation-Wise Distribution of Respondents
ICT devices used by faculty members to access E-resources: These table reveals about 90.6% of respondents are using their Laptops to access e-resources followed by smart Phones (68%), Desktops (53.1%) and very less number of respondents are using Note pads and Palmtops to access e-resources. The table clearly says that faculty members of both universities are given more preference to Laptops to access e-resources; it may be due to comfort in usage and easy to carry advantages (Table 4).
| N=128 | ||||
|---|---|---|---|---|
| ICT Devices | Responses (Multiple) | Percent of Cases (N=128) | Mean | |
| N | Percent | |||
| Desktop | 68 | 23.90% | 53.10% | 0.53 |
| Laptop | 116 | 40.80% | 90.60% | 0.91 |
| Note Pad | 10 | 3.50% | 7.80% | 0.08 |
| Smart Phone | 87 | 30.60% | 68.00% | 0.68 |
| Palmtop | 3 | 1.10% | 2.30% | 0.02 |
| Total | 284 | 100.00% | 221.9% | |
Table 4: ICT Devices used by Faculty Members to Access E-resources
Competency level of faculty members in using ICT Devices: The analysis of the above table shows that, the majority of respondents (115) opined that they are more competent in using laptops with the mean value of 1.13, followed by desktops (96) with mean value of 1.30 and smart phones (84) with the mean value of 1.42. The table also shows that 56.3% of respondents are not so competent in using Note pads followed by Palmtops (51.6%). The results of the table reveal that very few numbers of respondents are having fewer competencies in using laptop and desktops. Based on above statistics, it can be assumed that faculty members of universities are using laptops, desktops and smart phones more frequently than other devices; hence the competency level is more among faculty members in using these devices (Table 5).
| N=128 | |||||||
|---|---|---|---|---|---|---|---|
| ICT devices | Competency level → | More competent | Not so competent | Less competent | In competent | Total | Mean |
| Scale | 1 | 2 | 3 | 4 | |||
| Desktop | Frequency | 96 | 26 | 6 | 0 | 128 | 1.3 |
| Percent | 75 | 20.3 | 4.7 | 0 | 100 | ||
| Laptop | Frequency | 115 | 10 | 3 | 0 | 128 | 1.13 |
| Percent | 89.8 | 7.8 | 2.3 | 0 | 100 | ||
| Note pad | Frequency | 18 | 72 | 30 | 8 | 128 | 2.22 |
| Percent | 14.1 | 56.3 | 23.4 | 6.3 | 100 | ||
| Smart phone | Frequency | 84 | 34 | 10 | 0 | 128 | 1.42 |
| Percent | 65.6 | 26.6 | 7.8 | 0 | 100 | ||
| Palmtop | Frequency | 10 | 66 | 34 | 18 | 128 | 2.47 |
| Percent | 7.8 | 51.6 | 26.6 | 14.1 | 100 | ||
Table 5: Competency Level of Faculty Members in using ICT Devices
Purpose of using ICT devices: It is observed from the above table is that, laptop is used by majority of respondents for research (82%), class room instruction (85.9%), for effective teaching (98.4%), to access relevant information (73.4%) and to access scholarly content (85.2%) followed by desktop and smart phone. The table also exhibits that more number of respondents (49.2%) are using Smart phones for entertainment purpose followed by laptops (25%) and desktops (14.1%). It is clear from the above table is that the faculty members are choosing laptops and desktops for academic purposes but for entertainment they are giving preference to smart phones (Table 6).
| N=128 | |||||
|---|---|---|---|---|---|
| Purpose | Devices | Responses (Multiple) | Percent of Cases (N=128) | Mean | |
| N | Percent | ||||
| For research work | Desktop | 57 | 5.20% | 44.50% | 0.45 |
| Laptop | 105 | 9.50% | 82.00% | 0.82 | |
| Note Pad | 7 | 0.60% | 5.50% | 0.05 | |
| Smart Phone | 35 | 3.20% | 27.30% | 0.27 | |
| Palmtop | 3 | 0.30% | 2.30% | 0.02 | |
| For class room instruction | Desktop | 38 | 3.50% | 29.70% | 0.3 |
| Laptop | 110 | 10.00% | 85.90% | 0.86 | |
| Note Pad | 3 | 0.30% | 2.30% | 0.02 | |
| Smart Phone | 19 | 1.70% | 14.80% | 0.15 | |
| Palmtop | 0 | 0 | 0 | 0 | |
| To make teaching more effective | Desktop | 41 | 3.70% | 32.00% | 0.32 |
| Laptop | 126 | 11.40% | 98.40% | 0.98 | |
| Note Pad | 6 | 0.50% | 4.70% | 0.05 | |
| Smart Phone | 18 | 1.60% | 14.10% | 0.14 | |
| Palmtop | 0 | 0 | 0 | 0 | |
| To access current and relevant information | Desktop | 44 | 4.00% | 34.40% | 0.34 |
| Laptop | 94 | 8.50% | 73.40% | 0.73 | |
| Note Pad | 6 | 0.50% | 4.70% | 0.05 | |
| Smart Phone | 56 | 5.10% | 43.80% | 0.44 | |
| Palmtop | 4 | 0.40% | 3.10% | 0.03 | |
| To access scholarly content (e-journals, e-books etc.,) | Desktop | 56 | 5.10% | 43.80% | 0.44 |
| Laptop | 109 | 9.90% | 85.20% | 0.85 | |
| Note Pad | 6 | 0.50% | 4.70% | 0.05 | |
| Smart Phone | 36 | 3.30% | 28.10% | 0.28 | |
| Palmtop | 4 | 0.40% | 3.10% | 0.03 | |
| For entertainment | Desktop | 18 | 1.60% | 14.10% | 0.14 |
| Laptop | 32 | 2.90% | 25.00% | 0.25 | |
| Note Pad | 4 | 0.40% | 3.10% | 0.03 | |
| Smart Phone | 63 | 5.70% | 49.20% | 0.49 | |
| Palmtop | 1 | 0.10% | 0.80% | 0.01 | |
| Total | 1101 | 100.0% | 860.2% | ||
Table 6: Purpose of using ICT Devices
Extensiveness in usage of E-resources: It is seen from the Table 6 is that most of the respondents (75.8%) are used electronic journals in greater extent, followed by online databases (55.5%), electronic books (46.1), online reference books (42.2%), E-newspapers (37.5%) and Consortia (like UGC Infonet etc.,) (33.6%). The sources like E-thesis and Dissertations (42.2%), Institutional Repositories (41.4) and online reference books (40.6%) are moderately used by the respondents. The table also explores that OPAC (54.7%) and databases on CD/DVD (52.3%) are the sources used little extent by faculty members. It is also observed from above Table 27.3% of respondents opined that they are not at all used the source Databases on CD/DVD. Here, most extensively used source is e-journals (including consortium like UGC Infonet), it may be due to the faculty members are engaged in research activities, and hence they are using e-journals to get relevant literature. In other hand most of the respondents are not using CD/DVD databases or in little extent, it is mainly because of availability of online databases (Table 7).
| N=128 | |||||||
|---|---|---|---|---|---|---|---|
| E-resources | Greater extent | Moderate extent | Little extent | Not at all | Total | Mean | |
| Scale→ | 1 | 2 | 3 | 4 | |||
| Databases on CD/DVD | Frequency | 10 | 16 | 67 | 35 | 128 | 2.99 |
| Percent | 7.8 | 12.5 | 52.3 | 27.3 | 100 | ||
| Online databases | Frequency | 71 | 42 | 12 | 3 | 128 | 1.59 |
| Percent | 55.5 | 32.8 | 9.4 | 2.3 | 100 | ||
| Electronic journals (Full texts/Abstracts) | Frequency | 97 | 25 | 6 | 0 | 128 | 1.29 |
| Percent | 75.8 | 19.5 | 4.7 | 0 | 100 | ||
| Electronic books | Frequency | 59 | 50 | 17 | 2 | 128 | 1.7 |
| Percent | 46.1 | 39.1 | 13.3 | 1.6 | 100 | ||
| OPAC | Frequency | 17 | 29 | 70 | 12 | 128 | 2.6 |
| Percent | 13.3 | 22.7 | 54.7 | 9.4 | 100 | ||
| E-thesis and Dissertations | Frequency | 39 | 54 | 32 | 3 | 128 | 1.99 |
| Percent | 30.5 | 42.2 | 25 | 2.3 | 100 | ||
| Online reference books | Frequency | 54 | 52 | 20 | 2 | 128 | 1.77 |
| Percent | 42.2 | 40.6 | 15.6 | 1.6 | 100 | ||
| E-newspapers | Frequency | 48 | 40 | 35 | 5 | 128 | 1.98 |
| Percent | 37.5 | 31.3 | 27.3 | 3.9 | 100 | ||
| Institutional Repositories | Frequency | 32 | 53 | 35 | 8 | 128 | 2.15 |
| Percent | 25 | 41.4 | 27.3 | 6.3 | 100 | ||
| Consortia (like UGC Infonet etc.,) | Frequency | 43 | 51 | 31 | 3 | 128 | 1.95 |
| Percent | 33.6 | 39.8 | 24.2 | 2.3 | 100 | ||
Table 7: Extensiveness in Usage of E-resources
Purpose of E-resources serves to faculty members: It is clear from the Table 7 is that; e-resources are used by faculty members are mainly for research purpose and the percentage of respondents is lies in between 66.4 to 85.2% (mean value in between 0.66 to 0.85) followed by class Room Instruction and to make teaching more effective respectively. The table also denotes most of the respondents (68%) are using E-newspapers for to access current and relevant information followed by OPAC (53.9%) and 64.1% of respondents are using online reference books only for class room Instruction. Based on above table we can assume that most of the faculty members are actively involved in research activities therefore they are using e-resources more for research purpose (Table 8).
| N=128 | |||||
|---|---|---|---|---|---|
| E-resources | Purpose of Use | Responses (Multiple) | Percent of Cases (N=128) | Mean | |
| N | Percent | ||||
| Databases on CD/DVD | For Research Work | 85 | 4.30% | 66.40% | 0.66 |
| For Class Room Instruction | 24 | 1.20% | 18.80% | 0.19 | |
| To make teaching more effective | 25 | 1.30% | 19.50% | 0.2 | |
| To access current and relevant information | 24 | 1.20% | 18.80% | 0.19 | |
| "content (e-journals, e-books etc.,) | 19 | 1.00% | 14.80% | 0.15 | |
| Online databases | For Research Work | 98 | 4.90% | 76.60% | 0.77 |
| For Class Room Instruction | 51 | 2.60% | 39.80% | 0.4 | |
| To make teaching more effective | 42 | 2.10% | 32.80% | 0.33 | |
| To access current and relevant information | 34 | 1.70% | 26.60% | 0.27 | |
| "content (e-journals, e-books etc.,) | 23 | 1.20% | 18.00% | 0.18 | |
| Electronic journals (Full texts/Abstracts) | For Research Work | 109 | 5.50% | 85.20% | 0.85 |
| For Class Room Instruction | 44 | 2.20% | 34.40% | 0.34 | |
| To make teaching more effective | 35 | 1.80% | 27.30% | 0.27 | |
| To access current and relevant information | 33 | 1.70% | 25.80% | 0.26 | |
| "content (e-journals, e-books etc.,) | 25 | 1.30% | 19.50% | 0.2 | |
| Electronic books | For Research Work | 52 | 2.60% | 40.60% | 0.41 |
| For Class Room Instruction | 82 | 4.10% | 64.10% | 0.64 | |
| To make teaching more effective | 52 | 2.60% | 40.60% | 0.41 | |
| To access current and relevant information | 26 | 1.30% | 20.30% | 0.2 | |
| "content (e-journals, e-books etc.,) | 15 | 0.80% | 11.70% | 0.12 | |
| OPAC | For Research Work | 27 | 1.40% | 21.10% | 0.21 |
| For Class Room Instruction | 22 | 1.10% | 17.20% | 0.17 | |
| To make teaching more effective | 15 | 0.80% | 11.70% | 0.12 | |
| To access current and relevant information | 69 | 3.50% | 53.90% | 0.54 | |
| "content (e-journals, e-books etc.,) | 25 | 1.30% | 19.50% | 0.2 | |
| E-thesis and dissertations | For Research Work | 101 | 5.10% | 78.90% | 0.79 |
| For Class Room Instruction | 29 | 1.50% | 22.70% | 0.23 | |
| To make teaching more effective | 18 | 0.90% | 14.10% | 0.14 | |
| To access current and relevant information | 25 | 1.30% | 19.50% | 0.2 | |
| "content (e-journals, e-books etc.,) | 9 | 0.50% | 7.00% | 0.07 | |
| Online reference books | For Research Work | 57 | 2.90% | 44.50% | 0.45 |
| For Class Room Instruction | 82 | 4.10% | 64.10% | 0.64 | |
| To make teaching more effective | 45 | 2.30% | 35.20% | 0.35 | |
| To access current and relevant information | 19 | 1.00% | 14.80% | 0.15 | |
| "content (e-journals, e-books etc.,) | 11 | 0.60% | 8.60% | 0.09 | |
| E-newspapers | For Research Work | 28 | 1.40% | 21.90% | 0.22 |
| For Class Room Instruction | 34 | 1.70% | 26.60% | 0.27 | |
| To make teaching more effective | 19 | 1.00% | 14.80% | 0.15 | |
| To access current and relevant information | 87 | 4.40% | 68.00% | 0.68 | |
| "content (e-journals, e-books etc.,) | 10 | 0.50% | 7.80% | 0.08 | |
| Institutional repositories | For Research Work | 51 | 2.60% | 39.80% | 0.4 |
| For Class Room Instruction | 48 | 2.40% | 37.50% | 0.38 | |
| To make teaching more effective | 40 | 2.00% | 31.30% | 0.31 | |
| To access current and relevant information | 25 | 1.30% | 19.50% | 0.2 | |
| "content (e-journals, e-books etc.,) | 17 | 0.90% | 13.30% | 0.13 | |
| Consortia (like UGC Infonet etc.,) | For Research Work | 84 | 4.20% | 65.60% | 0.66 |
| For Class Room Instruction | 34 | 1.70% | 26.60% | 0.27 | |
| To make teaching more effective | 17 | 0.90% | 13.30% | 0.13 | |
| To access current and relevant information | 27 | 1.40% | 21.10% | 0.21 | |
| "content (e-journals, e-books etc.,) | 21 | 1.10% | 16.40% | 0.16 | |
| Total | 1994 | 100.0% | 1557.8% | ||
Table 8: Purpose of E-resources Serves to Faculty Members
Preferred search engines to access E-resources by faculty members: T able 8 identifies that leading search engine among respondents is Google, because majority of respondents (98.4%) preferred Google for their searching needs, followed by again Google Scholar (89.8%), Science research (41.4%) and Scinet Science search (25%). Other search engines like Yahoo, Hotbot, Infoseek etc., are less preferred by respondents. Based on above table, it seems that Google’s search ability, indexing of websites, versatility in searching; authenticated research articles and citation analysis facility in Google scholar are the key factors while choosing these search engines as their preferred search engines among faculty members (Table 9).
| N=128 | |||||
|---|---|---|---|---|---|
| Search engines | Most preferred | Less preferred | Not preferred | Total | |
| Yahoo | Frequency | 15 | 84 | 29 | 128 |
| Percent | 11.7 | 65.6 | 22.7 | 100 | |
| Frequency | 126 | 1 | 1 | 128 | |
| Percent | 98.4 | 0.8 | 0.8 | 100 | |
| Hot Bot | Frequency | 5 | 48 | 75 | 128 |
| Percent | 3.9 | 37.5 | 58.6 | 100 | |
| InfoSeek | Frequency | 6 | 51 | 71 | 128 |
| Percent | 4.7 | 39.8 | 55.5 | 100 | |
| Excite | Frequency | 5 | 37 | 86 | 128 |
| Percent | 3.9 | 28.9 | 67.2 | 100 | |
| Meta Eureka | Frequency | 6 | 89 | 33 | 128 |
| Percent | 4.7 | 69.5 | 25.8 | 100 | |
| Google Scholar | Frequency | 115 | 11 | 2 | 128 |
| Percent | 89.8 | 8.6 | 1.6 | 100 | |
| Scicentral | Frequency | 26 | 49 | 53 | 128 |
| Percent | 20.3 | 38.3 | 41.4 | 100 | |
| Scienceresearch | Frequency | 53 | 35 | 40 | 128 |
| Percent | 41.4 | 27.3 | 31.3 | 100 | |
| Strategian | Frequency | 6 | 33 | 89 | 128 |
| Percent | 4.7 | 25.8 | 69.5 | 100 | |
| Scinet Science Search | Frequency | 32 | 43 | 53 | 128 |
| Percent | 25 | 33.6 | 41.4 | 100 | |
Table 9: Preferred Search Engines to Access E-resources by Faculty Members
Search techniques used by faculty members to access E-resources : It is found from the above table is that; the majority of respondents (93%) opined that, they are using keywords to search the information in search engines followed by field search technique (64.1%), DOI based search (35.2%) and Phrase search (30.5%). Keyword search technique is very easy and common mode of search; hence the most of respondents are using that search technique (Table 10).
| N=128 | |||||
|---|---|---|---|---|---|
| Search techniques | Most preferred | Less preferred | Not preferred | Total | |
| Keywords | Frequency | 119 | 9 | 0 | 128 |
| Percent | 93 | 7 | 0 | 100 | |
| Field search | Frequency | 82 | 41 | 5 | 128 |
| Percent | 64.1 | 32 | 3.9 | 100 | |
| Phrase search | Frequency | 39 | 72 | 17 | 128 |
| Percent | 30.5 | 56.3 | 13.3 | 100 | |
| Using Boolean Operators | Frequency | 19 | 73 | 36 | 128 |
| Percent | 14.8 | 57 | 28.1 | 100 | |
| DOI (Digital Object Identifier) based search | Frequency | 45 | 52 | 31 | 128 |
| Percent | 35.2 | 40.6 | 24.2 | 100 | |
| GUI (Graphical User interface) search | Frequency | 21 | 60 | 47 | 128 |
| Percent | 16.4 | 46.9 | 36.7 | 100 | |
Table 10: Search Techniques used by Faculty Members to Access E-resources
Preferred file formats to access and downl oad E-resources by faculty members: Statistics of the above table shows that PDF is the most preferred file format among respondents and 99.2% of respondents are choosing PDF file format while downloading eresources, followed by MS word (70.3%), PPT (64.8%), JPEG (38.3%), Excel (xls) (34.4%) and HTML with 21.1%. In the other hand 56.3% of respondents expressed that HTML and Excel file formats are less preferred followed by JPEG (55.5%) and other file formats like SGML, CDF, HDF, XDF, DELTA and MAT file are either less preferred or not preferred formats among respondents. The table exhibits that PDF format is very popular among users for downloading the e-content and it is mainly due to its compatibility and user friendly (Table 11).
| N=128 | |||||
|---|---|---|---|---|---|
| File formats | Most preferred | Less preferred | Not preferred | Total | |
| HTML | Frequency | 27 | 72 | 29 | 128 |
| Percent | 21.1 | 56.3 | 22.7 | 100 | |
| MS-Word (doc) | Frequency | 90 | 33 | 5 | 128 |
| Percent | 70.3 | 25.8 | 3.9 | 100 | |
| Excel (xls) | Frequency | 44 | 72 | 12 | 128 |
| Percent | 34.4 | 56.3 | 9.4 | 100 | |
| PPT | Frequency | 83 | 43 | 2 | 128 |
| Percent | 64.8 | 33.6 | 1.6 | 100 | |
| JPEG | Frequency | 49 | 71 | 8 | 128 |
| Percent | 38.3 | 55.5 | 6.3 | 100 | |
| Frequency | 127 | 0 | 1 | 128 | |
| Percent | 99.2 | 0 | 0.8 | 100 | |
| SGML (Standard Generalized Markup Language) | Frequency | 7 | 65 | 56 | 128 |
| Percent | 5.5 | 50.8 | 43.8 | 100 | |
| CDF (Common Data Format) | Frequency | 11 | 50 | 67 | 128 |
| Percent | 8.6 | 39.1 | 52.3 | 100 | |
| HDF(Hierarchical Data Format) | Frequency | 7 | 61 | 60 | 128 |
| Percent | 5.5 | 47.7 | 46.9 | 100 | |
| XDF (Extensible Data Format) | Frequency | 8 | 44 | 76 | 128 |
| Percent | 6.3 | 34.4 | 59.4 | 100 | |
| DELTA | Frequency | 9 | 41 | 78 | 128 |
| Percent | 7 | 32 | 60.9 | 100 | |
| MAT file | Frequency | 10 | 42 | 76 | 128 |
| Percent | 7.8 | 32.8 | 59.4 | 100 | |
Table 11: Preferred File Formats to Access and Download E-resources by Faculty Members
Level of competency in utilizing E-resources: Table 11 indicates that respondents are more competent in using Electronic journals (89.8%) followed by online databases (75%), Electronic books (74.2%), Online reference books (68.8%), E-newspapers (67.2%), E-thesis and Dissertations (64.1) and Consortia (like UGC Infonet etc.,) with 44.4%. 46.1% of respondents also exhibits that they have not so competent in using OPAC and Institutional Repositories, followed by Consortia (like UGC Infonet etc.,) (45.3%) and Databases on CD/DVD (30.5%). The table also shows that 25.8% of respondents are having fewer competencies in using OPAC followed by databases on CD/DVD with 23.4%. It is clear from above table is that the faculty members have processed good competency in utilizing most of the e-resources except some sort of resources like OPAC and databases on CD/DVD. It is also observed from the statistics faculty members are not enough competent in using OPAC, UGC infonet resources. Hence library and library professionals need to focus on this and there is need to conduct more and more awareness programmes among faculty members on using of OPAC and UGC Infonet resources (Table 12).
| N=128 | |||||||
|---|---|---|---|---|---|---|---|
| E-resources | More competent | Not so competent | Less competent | In competent | Total | Mean | |
| Scale → |
1 | 2 | 3 | 4 | |||
| Databases on CD/DVD | Frequency | 45 | 39 | 30 | 14 | 128 | 2.1 |
| Percent | 35.2 | 30.5 | 23.4 | 10.9 | 100 | ||
| Online databases | Frequency | 96 | 26 | 6 | 0 | 128 | 1.3 |
| Percent | 75 | 20.3 | 4.7 | 0 | 100 | ||
| Electronic journals (Full texts/Abstracts) | Frequency | 115 | 6 | 7 | 0 | 128 | 1.16 |
| Percent | 89.8 | 4.7 | 5.5 | 0 | 100 | ||
| Electronic books | Frequency | 95 | 28 | 4 | 1 | 128 | 1.3 |
| Percent | 74.2 | 21.9 | 3.1 | 0.8 | 100 | ||
| OPAC | Frequency | 28 | 59 | 33 | 8 | 128 | 2.16 |
| Percent | 21.9 | 46.1 | 25.8 | 6.3 | 100 | ||
| E-thesis and Dissertations | Frequency | 82 | 32 | 10 | 4 | 128 | 1.5 |
| Percent | 64.1 | 25 | 7.8 | 3.1 | 100 | ||
| Online reference books | Frequency | 88 | 26 | 13 | 1 | 128 | 1.43 |
| Percent | 68.8 | 20.3 | 10.2 | 0.8 | 100 | ||
| E-newspapers | Frequency | 86 | 27 | 13 | 2 | 128 | 1.46 |
| Percent | 67.2 | 21.1 | 10.2 | 1.6 | 100 | ||
| Institutional Repositories | Frequency | 49 | 59 | 15 | 5 | 128 | 1.81 |
| Percent | 38.3 | 46.1 | 11.7 | 3.9 | 100 | ||
| Consortia (like UGC Infonet etc.,) | Frequency | 53 | 58 | 10 | 7 | 128 | 1.77 |
| Percent | 41.4 | 45.3 | 7.8 | 5.5 | 100 | ||
Table 12: Level of Competency in Utilizing E-resources
Level of proficiency in ICT enabled activities: The above table exhibits that 66.4% of respondents expressed like they are excellent in ICT enabled activities like use of internet, followed by Word processing skills (MS word etc.,) (59.4%), Telecommunication Skills (Emails, messengers etc.,) (55.5%), Use of databases, e-books, e-journals etc., (Scholarly Content) (53.1%) and only 32% of respondents are excellent in Installation and customization of hardware and software. Among faculty members 47.7% of respondents having good level of proficiency in Use of online library services (like Web-OPAC, Institutional Repositories etc.,), followed by Spreadsheet and Graphing skills (Excel etc.,) and Use of advanced search with Boolean operators (37.5%), Downloading of articles in different file formats (35.2%) and Use of Internet 30.5%. The table also denotes respondents are fair in proficiency in Use of Frequently Asked Questions (FAQ’s) in websites (32%), followed by Installation and customization of hardware and software and Use of advanced search with Boolean operators (28.1%). Faculty members are poor in using RSS (Really Simple Syndication) service with the percentage of 35.2.
The overall statistics of the table indicates that majority of the respondents having either excellent or good in proficiency level in ICT enabled activities but respondents are expressed either fair or poor in using of RSS (Really Simple Syndication) service (56.3%), followed by Ability to use “Alert” service offered by databases (50%), Ability to participate in discussion groups/forums of interest on internet (Social Networks) (43%), Use of Frequently Asked Questions (FAQ’s) in websites (41.4%), Use of advanced search with Boolean operators (39.1%) and Installation and customization of hardware and software (35.9%).
Based on the above statistics it is identified that faculty members need more training on the fields like using of RSS (Really Simple Syndication) service, “Alert” service, discussion groups/forums, Use of Frequently Asked Questions (FAQ’s) in websites, Use of advanced search with Boolean operators and Installation and customization of hardware and software to increase their proficiency level (Table 13).
| N=128 | |||||||
|---|---|---|---|---|---|---|---|
| ICT enabled activities | Excellent | Good | Fair | Poor | Total | Mean | |
| Scale → | 1 | 2 | 3 | 4 | |||
| Installation and customization of hardware and software | Frequency | 41 | 41 | 36 | 10 | 128 | 2.12 |
| Percent | 32 | 32 | 28.1 | 7.8 | 100 | ||
| Use of internet | Frequency | 85 | 39 | 4 | 0 | 128 | 1.37 |
| Percent | 66.4 | 30.5 | 3.1 | 0 | 100 | ||
| Use of online library services (like Web-OPAC, Institutional Repositories etc.,) | Frequency | 50 | 61 | 16 | 1 | 128 | 1.75 |
| Percent | 39.1 | 47.7 | 12.5 | 0.8 | 100 | ||
| Downloading of articles in different file formats | Frequency | 75 | 45 | 8 | 0 | 128 | 1.48 |
| Percent | 58.6 | 35.2 | 6.3 | 0 | 100 | ||
| Word processing skills (MS word etc.,) | Frequency | 76 | 37 | 15 | 0 | 128 | 1.52 |
| Percent | 59.4 | 28.9 | 11.7 | 0 | 100 | ||
| Spreadsheet and Graphing skills (excel etc.,) | Frequency | 44 | 48 | 30 | 6 | 128 | 1.98 |
| Percent | 34.4 | 37.5 | 23.4 | 4.7 | 100 | ||
| Telecommunication Skills (E-mails, messengers etc.,) | Frequency | 71 | 44 | 10 | 3 | 128 | 1.57 |
| Percent | 55.5 | 34.4 | 7.8 | 2.3 | 100 | ||
| Use of advanced search with Boolean operators | Frequency | 30 | 48 | 36 | 14 | 128 | 2.27 |
| Percent | 23.4 | 37.5 | 28.1 | 10.9 | 100 | ||
| Use of databases, e-books, e-journals etc., (Scholarly Content) | Frequency | 68 | 37 | 22 | 1 | 128 | 1.66 |
| Percent | 53.1 | 28.9 | 17.2 | 0.8 | 100 | ||
| Use of RSS (Really Simple Syndication) service | Frequency | 18 | 38 | 27 | 45 | 128 | 2.77 |
| Percent | 14.1 | 29.7 | 21.1 | 35.2 | 100 | ||
| Ability to use “Alert” service offered by databases | Frequency | 26 | 38 | 31 | 33 | 128 | 2.55 |
| Percent | 20.3 | 29.7 | 24.2 | 25.8 | 100 | ||
| Use of Frequently Asked Questions (FAQ’s) in websites | Frequency | 35 | 40 | 41 | 12 | 128 | 2.23 |
| Percent | 27.3 | 31.3 | 32 | 9.4 | 100 | ||
| Ability to participate in discussion groups/forums of interest on internet (Social Networks) | Frequency | 34 | 39 | 31 | 24 | 128 | 2.35 |
| Percent | 26.6 | 30.5 | 24.2 | 18.8 | 100 | ||
Table 13: Level of Proficiency in ICT Enabled Activities
Ratings given by faculty members for E-resources features: Table 13 shows that the faculty members are given excellent (rating) to the Easy accessibility (60.2%) feature of eresources, followed by features like availability of the journal much before the print copy (52.3%), Downloading facility (48.4%), less time in searching (46.9%) and improved professional competence (46.1%). Faculty members also expressed good (rating) for the features like archival facility (54.7%), followed by expedite the research process (53.1%), less time in searching and access to wider range of information (50.8%), simultaneous usage, author can be contacted directly through e-mail and Improved professional competence with the percentage of 50. Very less members are given fair and poor ratings for e-resources features. Hence, the majority of respondents are given Excellent or Good rating to e-resources features (Table 14).
| N=128 | ||||||
|---|---|---|---|---|---|---|
| Features | Excellent | Good | Fair | Poor | Total | |
| Less time in searching | Frequency | 60 | 65 | 3 | 0 | 128 |
| Percent | 46.9 | 50.8 | 2.3 | 0 | 100 | |
| Availability of the journal much before the print copy | Frequency | 67 | 56 | 4 | 1 | 128 |
| Percent | 52.3 | 43.8 | 3.1 | 0.8 | 100 | |
| Simultaneous usage | Frequency | 58 | 64 | 6 | 0 | 128 |
| Percent | 45.3 | 50 | 4.7 | 0 | 100 | |
| Easy accessibility | Frequency | 77 | 46 | 5 | 0 | 128 |
| Percent | 60.2 | 35.9 | 3.9 | 0 | 100 | |
| Downloading facility | Frequency | 62 | 59 | 5 | 2 | 128 |
| Percent | 48.4 | 46.1 | 3.9 | 1.6 | 100 | |
| Author can be contacted directly through e-mail | Frequency | 53 | 64 | 8 | 3 | 128 |
| Percent | 41.4 | 50 | 6.3 | 2.3 | 100 | |
| Archival facility | Frequency | 46 | 70 | 9 | 3 | 128 |
| Percent | 35.9 | 54.7 | 7 | 2.3 | 100 | |
| Access to wider range of information | Frequency | 55 | 65 | 7 | 1 | 128 |
| Percent | 43 | 50.8 | 5.5 | 0.8 | 100 | |
| Improved professional competence | Frequency | 59 | 64 | 2 | 3 | 128 |
| Percent | 46.1 | 50 | 1.6 | 2.3 | 100 | |
| Expedite the research process | Frequency | 53 | 68 | 6 | 1 | 128 |
| Percent | 41.4 | 53.1 | 4.7 | 0.8 | 100 | |
Table 14: Ratings given by Faculty Members for E-resources Features
Hindrances faced by faculty members while using E-resources: The table denotes that hindrances faced by faculty members in accessing e-resources, 29.7% respondents faced the hindrance lack of training in use of ICT tools and applications in greater extent, followed by inability to acquire/own ICT facilities (22.7%). The faculty members also expressed Inability to acquire/own ICT facilities (32%), No ICT facilities at workplace (30.5%), Lack of ICT knowledge (29.7%), Lack of training in use of ICT tools and applications (20.3%) are the hindrances faced by the faculty members in moderate extent. The table also exhibits Lack of access to e-resources in my subject/area (24.2%), Lack of ICT knowledge (22.7%), Lack of training in use of ICT tools and applications (21.9%) these are the some hindrances faced by the faculty members in little extent. The table also shows that the majority of respondents (overall) 71.9% expressed that lack of training in use of ICT tools and applications is the major hindrance faced by the respondents (Table 15).
| N=128 | ||||||
|---|---|---|---|---|---|---|
| Hindrances | Greater extent | Moderate extent | Little extent | Not a hindrance | Total | |
| Inability to acquire/own ICT facilities | Frequency | 29 | 41 | 21 | 37 | 128 |
| Percent | 22.7 | 32 | 16.4 | 28.9 | 100 | |
| No ICT facilities at workplace | Frequency | 14 | 39 | 21 | 54 | 128 |
| Percent | 10.9 | 30.5 | 16.4 | 42.2 | 100 | |
| Lack of ICT knowledge | Frequency | 11 | 38 | 29 | 50 | 128 |
| Percent | 8.6 | 29.7 | 22.7 | 39.1 | 100 | |
| Lack of training in use of ICT tools and applications | Frequency | 38 | 26 | 28 | 36 | 128 |
| Percent | 29.7 | 20.3 | 21.9 | 28.1 | 100 | |
| Lack of assistance from library staff | Frequency | 20 | 32 | 24 | 52 | 128 |
| Percent | 15.6 | 25 | 18.8 | 40.6 | 100 | |
| Lack of access to e-resources in my subject/area | Frequency | 17 | 25 | 31 | 55 | 128 |
| Percent | 13.3 | 19.5 | 24.2 | 43 | 100 | |
| Lack of time to use e-resources | Frequency | 13 | 28 | 27 | 60 | 128 |
| Percent | 10.2 | 21.9 | 21.1 | 46.9 | 100 | |
Table 15: Hindrances Faced by Faculty Members while Using E-resources
Training needed areas for optimum usage E-resourcers: The data from the above table expressed that majority of respondents opined that they need training on different areas like training on using various ICT tools/devices (69.9%), followed by training on various eresources available (59.3%), Training on methods/strategies available to access e-resources (55.3%), Training on utilizing the IT infrastructure (49.6%) and training on art of reading/concise/briefing application of e-resources for teaching/research (37.4%) (Table 16).
| N=128 | |||
|---|---|---|---|
| Training areas | Responses (Multiple) | Percent of Cases | |
| N | Percent | ||
| Training on using various ICT tools/devices | 86 | 25.70% | 69.90% |
| Training on various e-resources available | 73 | 21.90% | 59.30% |
| Training on methods/strategies available to access e-resources | 68 | 20.40% | 55.30% |
| Training on art of reading/concise/briefing application of e-resources for teaching/research | 46 | 13.80% | 37.40% |
| Training on utilizing the IT infrastructure | 61 | 18.30% | 49.60% |
| Total | 334 | 100.00% | 271.50% |
Table 16: Training Needed Areas for Optimum usage E-resources
Major finding of the study
The analysis of the study gives following findings.
• Majority of faculty members are using Laptops, Desktops and smart phones to access e-resources with good competency level and in other hand devices like palmtop, notepads were less used and they have less competency in using these devices.
• If it comes to purpose of using devices the faculty members chosen laptop with high priority for purposes like research, class room instruction, effective teaching, to access relevant information and to access scholarly content followed by desktop and Smartphone. But half of the population opined that they are using Smart phones for entertainment purpose followed by laptops.
• Most of the faculty members used e-resources for research purpose, followed by class Room instruction and to make teaching more effective respectively.
• Google and Google scholar are most used search engines among faculty members and they preferred “keyword” based searching.
• PDF is the most preferred file format among respondents followed by MS word and PPT
• Major portion of the population expressed that they are more competent in using Electronic journals followed by online databases, Electronic books, online reference books, E-newspapers and E-thesis and Dissertations. They also opined that they are not enough competent in using OPAC and UGC infonet resources.
• The study revealed that more than half of the study population expressed that they are excellent in ICT enabled activities like use of internet, followed by Word processing skills (MS word etc.,), Telecommunication Skills (E-mails, messengers etc.,), Use of databases, e-books, e-journals etc., (Scholarly Content). It is also identified from the study is that faculty members have fair proficiency in Installation and customization of hardware and software and use of advanced search with Boolean operators but they are poor in using RSS (Really Simple Syndication) service.
• Majority of respondents are given Excellent or Good rating to e-resources features like Less time in searching, Simultaneous usage, Easy accessibility, Downloading facility, Archival facility and Access to wider range of information etc.,
• Overall 71.9% of respondents expressed that lack of training in use of ICT tools and applications is the major hindrance faced by them.
• Most of the faculty members opined that they need training on using various ICT tools/devices, on e-resources available and on methods/strategies available to access eresources to betterment of their usage skills
Suggestions
Based on the above study, we have framed some useful suggestions to improve the skills of faculty members in using e-resources more effectively.
• University administration should organize training programs regularly for faculty members on usage of ICT devices, what are the e-resources available, strategies to access precise information on the online platform and skills to adapt to access and utilize e-resources in optimum level.
• Library and information center of the universities should encourage them to use eresources like consortia based e-resources (UGC-Infonet) along with other sources available on online platform and should organize awareness programs on e-resources and Opac/Webopac facility etc., because major portion of the faculty members expressed that they are not getting proper assistance from library staff. Hence, library staff of the university libraries should take this seriously and work on it and make them aware of e-resources and also services available in libraries.
• Majority of faculty members are using only keyword based searching and they are given more preference to this, but to get relevant and precise information faculty members should use advanced search facility, it is available almost all type of information databases, which helps to get relevant information and it saves the searching time also.
Conclusion
To access and utilize e-resources effectively, it is necessary to possess the skills to use ICT devices, skills to access e-resources and to retrieve correct and precise information in minimum time. Make us competent ourselves in using e-resources is became need of the day. We should upgrade ourselves with changing technology and it is very much essential for everyone to use the technology efficiently. The people engaged in higher education, like university teachers needs to make them competent in using e-resources. The study showed that faculty members of said two universities have good competency level in using eresources in spite of this some portion of faculty members are still lack behind in using eresources effectively. Hence, University administration and University libraries have to play major role in making them competent in using e-resources by organizing awareness and training programs regularly, which helps faculty members to improve their ICT skills and it make them more competent in using e-resources.
References
- Zare-ee, Abbas. "University teachers' views on the use of information communication technologies in teaching and research." Turkish Online J Educ Technol 10.3 (2011): 318-327.
- Sivakami, N., and N. Rajendran. "Awareness, access and usage of e-resources among faculty members in arts and science colleges." Libr Philos Pract (2019): 1-9.
- Srinivasulu, P., C. Chinna Balu, and A. Narendra. "Awareness and usage of e-resources by faculty members at Vardhaman College of Engineering (Autonomous), Hyderabad: A Study." Libr Philos Pract (2019): 1-16.
- Lakpathi, K., Vivekavardhan, J., & Kumar, R. “Problems and challenges of utilization of electronic information resources by the research scholars of Osmania University”. Easy Chair Preprint (20191).
- Girakaduwa, Saman. "Usage of electronic resources, services and challenges faced by the library users in University of the Visual and Performing Arts (UVPA), Sri Lanka." Int J Soc Sci 5.2 (2019): 34-43.
- Shashikala, H. M., and S. Srinivasaragavan. "Usage of E-resources by the faculty members and pg students of Kempegowda Institute of Medical Sciences Hospital and Research Centre (KIMS), Bangalore, Karnataka: A Study." Asian J Inf Technol (AJIST) 9.2 (2019).
- Esh M. Usage of e-Journals in University of North Bengal under INFLIBNET (2012-2018): Analysis with INFISTATS. DESIDOC J Libr Inf Technol. (2019);39(4):199-204.
- Akuffo, Maxwell N., and Stephen Budu. "Use of electronic resources by students in a premier postgraduate theological university in Ghana." S Afr J Inf Manag 21.1 (2019): 1-9.
- Soni, Navin Kumar, Kapil Kumar Gupta, and Jitendra Shrivastava. "Awareness and usage of electronic resources among LIS scholars of Jiwaji University, Gwalior: A survey." (2018).
- Ahmed, Aquil, and Sulaiman Al-Reyaee. "Knowledge and Use of Electronic Information Resources by Medical Students at Al-Jouf University in Saudi Arabia." Libr Philos Pract (2017).
- Borgohain, Trinayan, and Nandita Barman. "Knowledge and use of e-resources by faculty and research students at the Dibrugarh University, Assam." Informatics Studies 3.3 (2017): 50-56.
- Kashyap and Santu Ram. "Use of e-resources by university faculty members of Madhya Pradesh and Chhattisgarh: A comparative study." Int J Digit Libr 6.2 (2016): 56-62.
Author Info
Hemesha H. N1* and Santhosh Kumar K. T2*2Department of Library & Information Science, Kuvempu University of Science, Shivamogga District, Karnataka-577201, India
Received: 24-Jul-2022, Manuscript No. IJLIS-22-70145; Editor assigned: 27-Jul-2022, Pre QC No. IJLIS-22-70145(PQ); Reviewed: 18-Aug-2022, QC No. IJLIS-22-70145; Revised: 25-Aug-2022, Manuscript No. IJLIS-22-70145(R); Published: 01-Sep-2022, DOI: 10.35248/2231-4911.22.12.838
Copyright: This is an open access article distributed under the terms of the Creative Commons Attribution License, which permits unrestricted use, distribution, and reproduction in any medium, provided the original work is properly cited.
Call for Papers
Authors can contribute papers on
What is Your ORCID
Register for the persistent digital identifier that distinguishes you from every other researcher.
Social Bookmarking
Know Your Citation Style
American Psychological Association (APA)
Modern Language Association (MLA)
American Anthropological Association (AAA)
Society for American Archaeology
American Antiquity Citation Style
American Medical Association (AMA)
American Political Science Association(APSA)

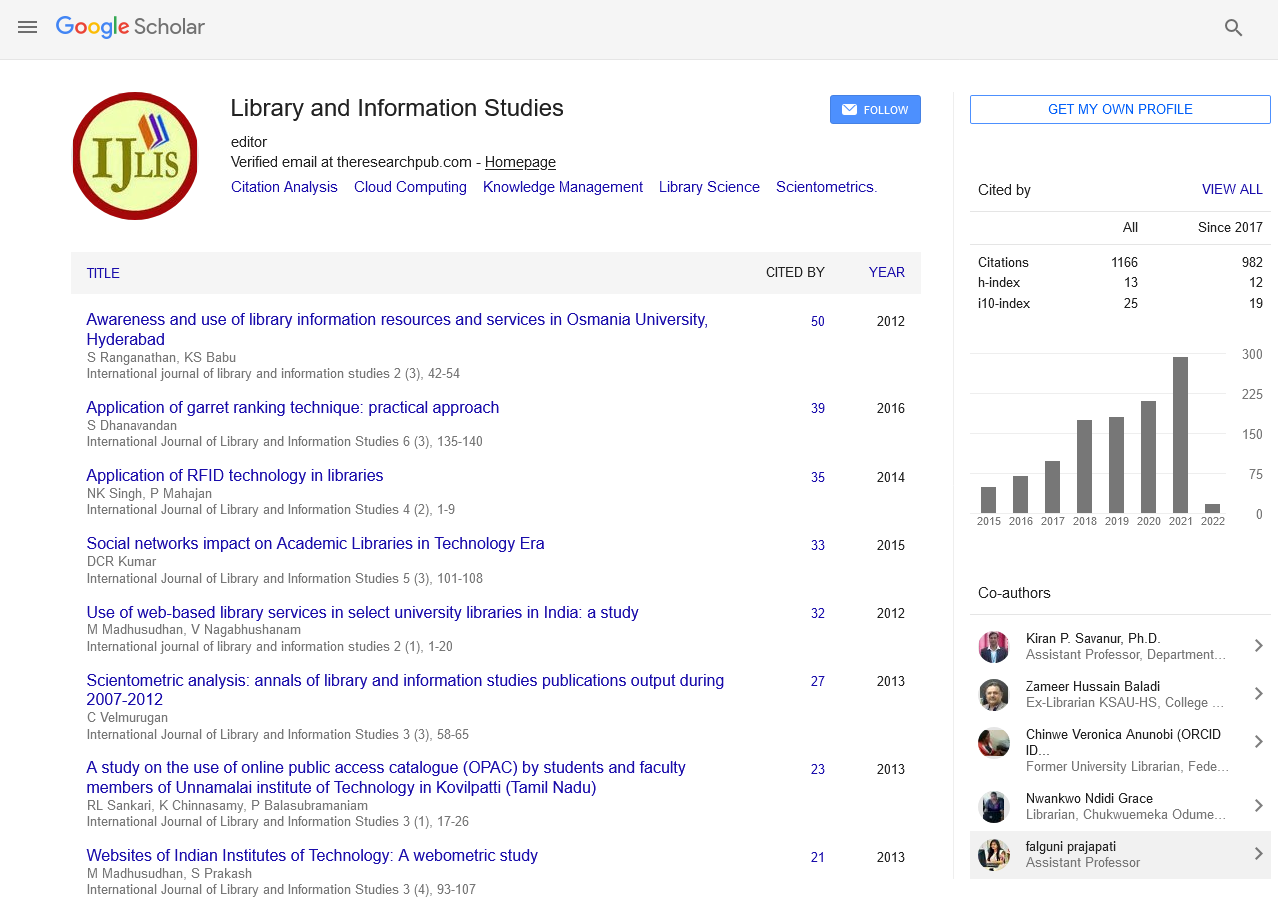
Google Scholar citation report
Citations : 1680
International Journal of Library and Information Studies peer review process verified at publons
Indexed In
Bibliography & Citation Tools
